
Research
The majority of my research experience has focused on qualitative research, using insights gathered from users and stakeholders to define user requirements, establish UX scope, and inform product direction. Applying these research methods has helped drive more effective design decisions, improve usability, and increase user efficiency and productivity by over 45%.
Additionally, I have mentored and assisted interns in developing internal usage-tracking dashboards, helping them identify meaningful metrics, organize data, and build reporting tools that enable product teams to make more informed, data-driven decisions.
KROGER USE CASE 1
THE PROBLEM
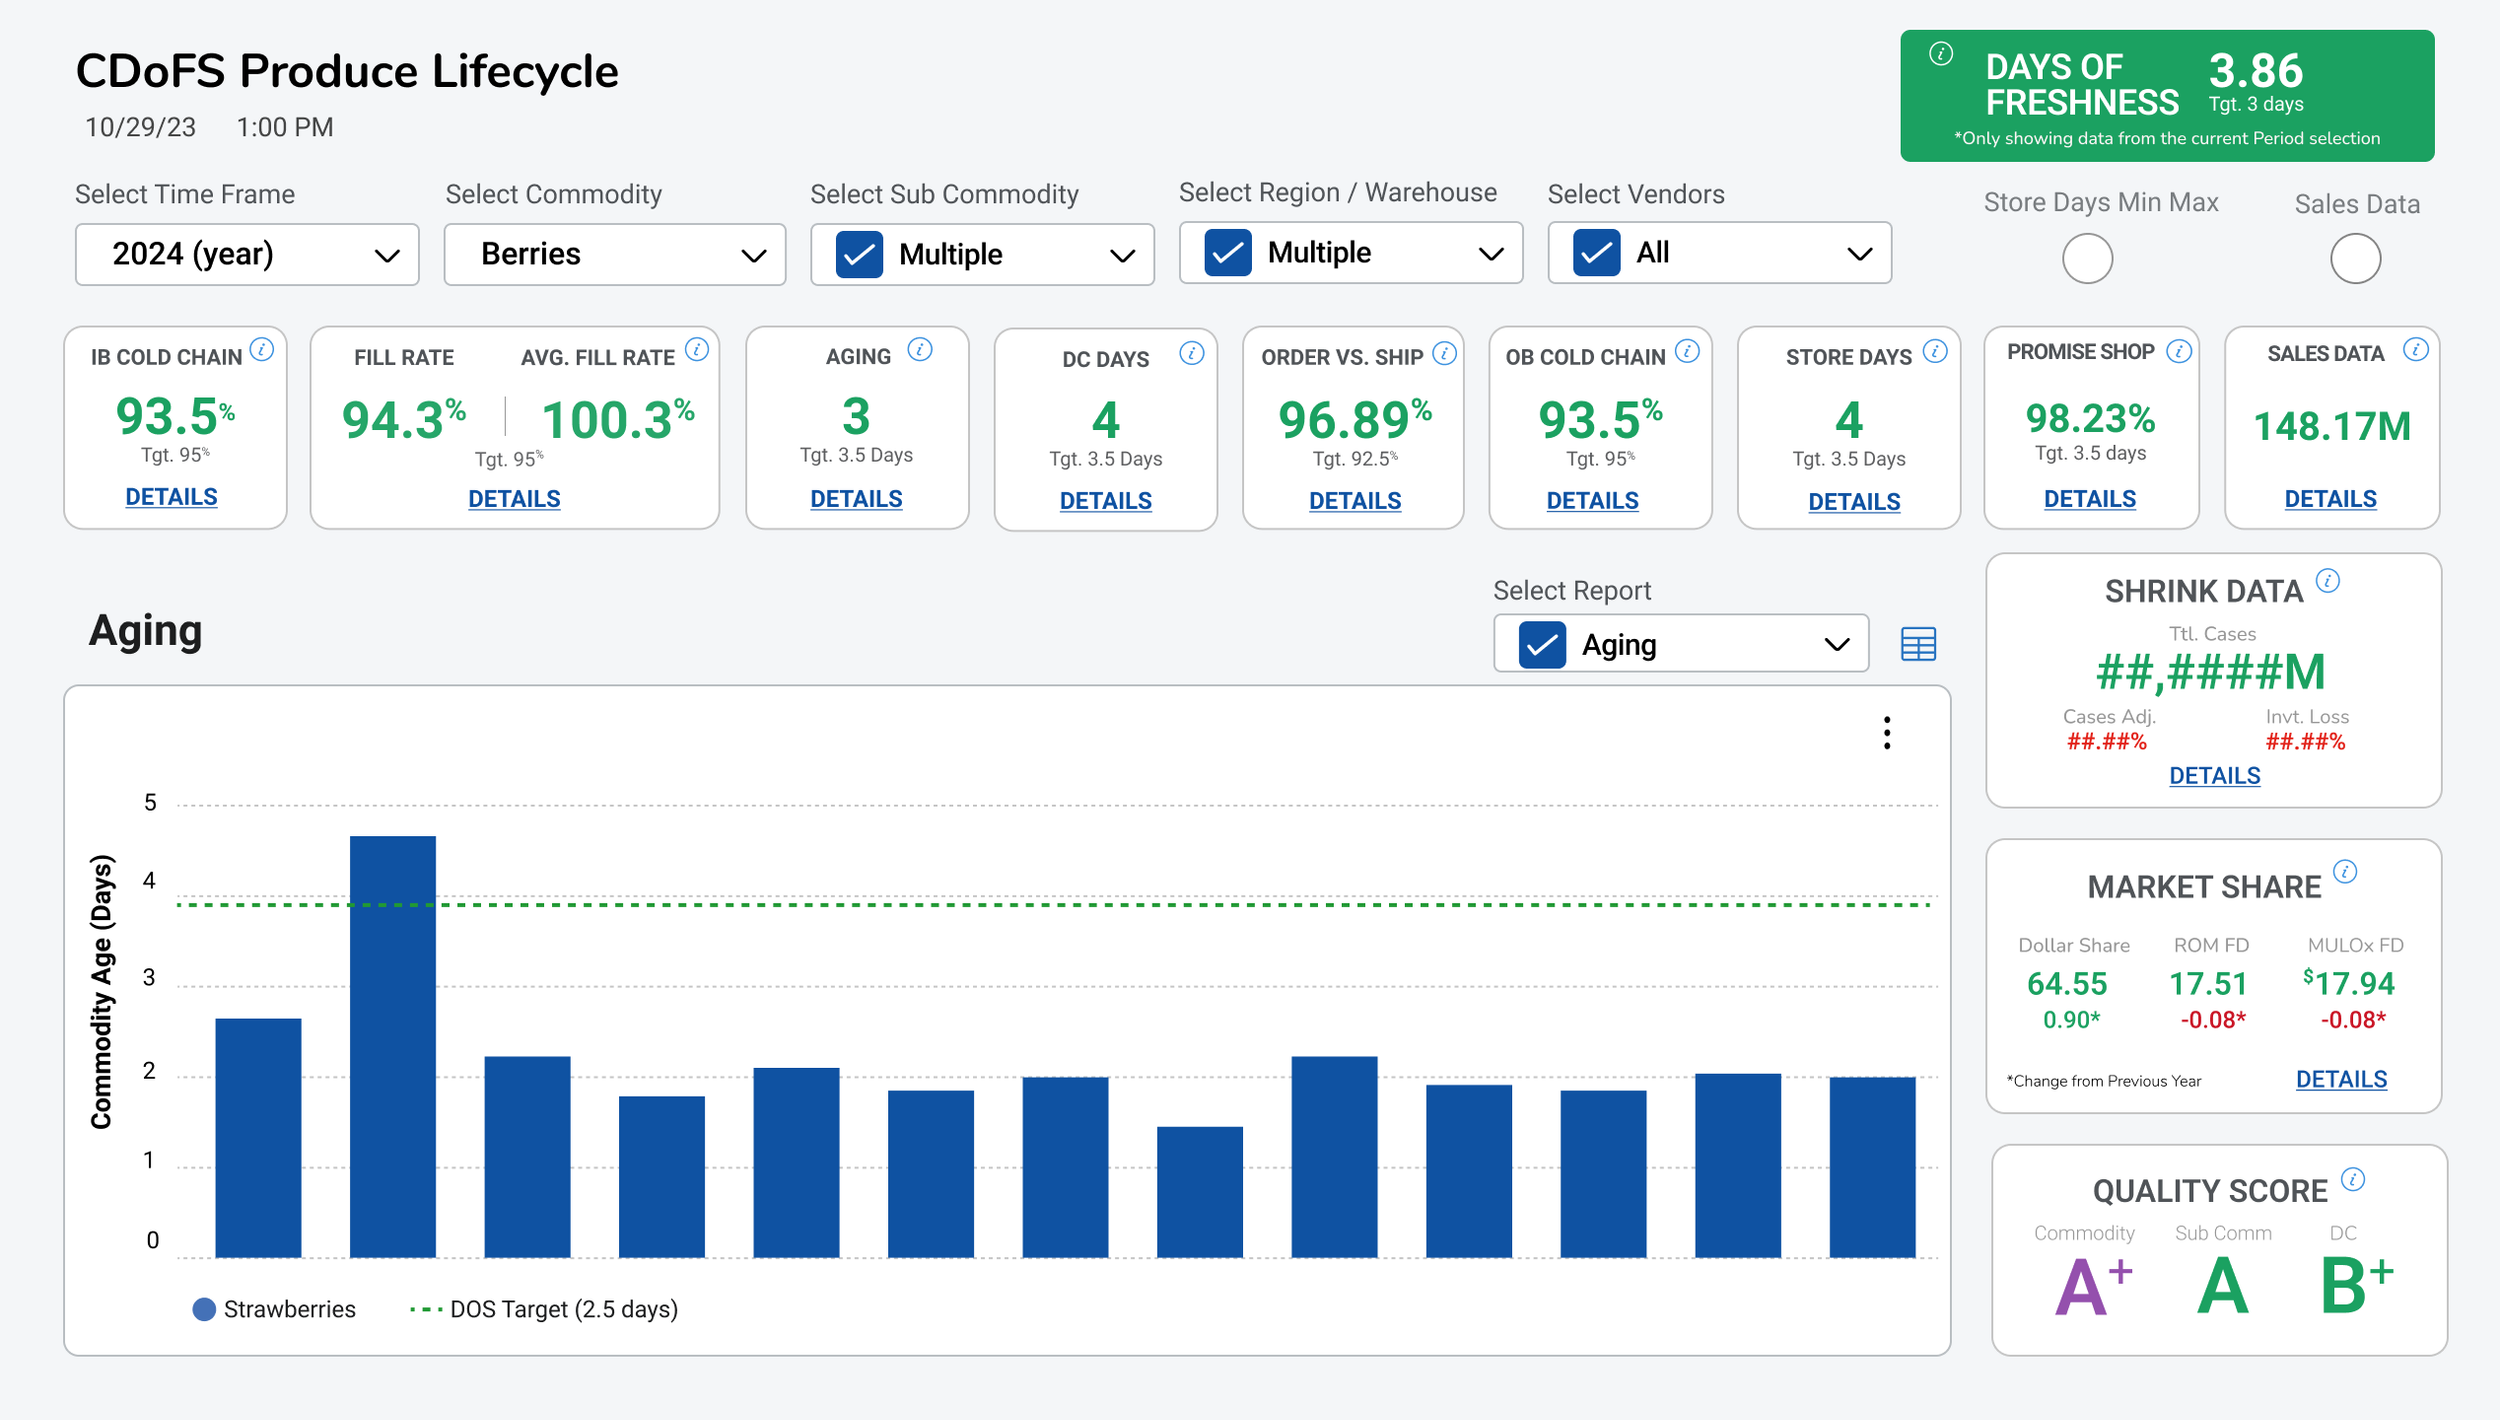
Kroger had a report that was ‘messy’. The report was carrying alot of data and was a HUGE driver for all users to help them make fast, business decisions to help with their Fresh Initiative Golas including capturing sales metrics, managing shrink and vendor quality.
Identified UX/UI Issues & Opportunities for Improvement
Poor Information Organization: Reports and data were scattered throughout the interface, making it difficult for users to locate and interpret relevant information quickly.
Lack of Data Hierarchy: No clear prioritization or structure of information, creating unnecessary cognitive load and slowing users' ability to make informed decisions.
Inconsistent KPI Prioritization: All KPIs carried equal visual weight, with no clear hierarchy or distinction between primary and secondary performance indicators.
Redundant Data Visualization: Repetitive bar graphs were displayed without adding meaningful value to the screen, creating unnecessary visual clutter and taking up valuable space.
Missed Opportunity for Actionable Insights: The presentation of data lacked a clear focus on the most relevant metrics, making it harder for users to identify trends, prioritize actions, and make timely business decisions.
Conducted brief interviews
Given my understanding of the business logic behind the Fresh Initiative and the relationships between its KPIs, I recognized an opportunity to help users establish a more meaningful data hierarchy.
I invited approximately 7 users from each user group to participate in a brief 5-minute card-sorting exercise. The goal was to understand how they naturally prioritized, grouped, and interpreted the KPIs that mattered most to their roles.
I positioned the activity as a way to help improve their reporting experience, making it easier to identify critical business metrics, access relevant information, and make timely, informed Fresh Initiative business decisions with greater speed and efficiency.
To learn more about this product and my process, click here for a full presentation or contact me directly at: asmith@smithdezign.com
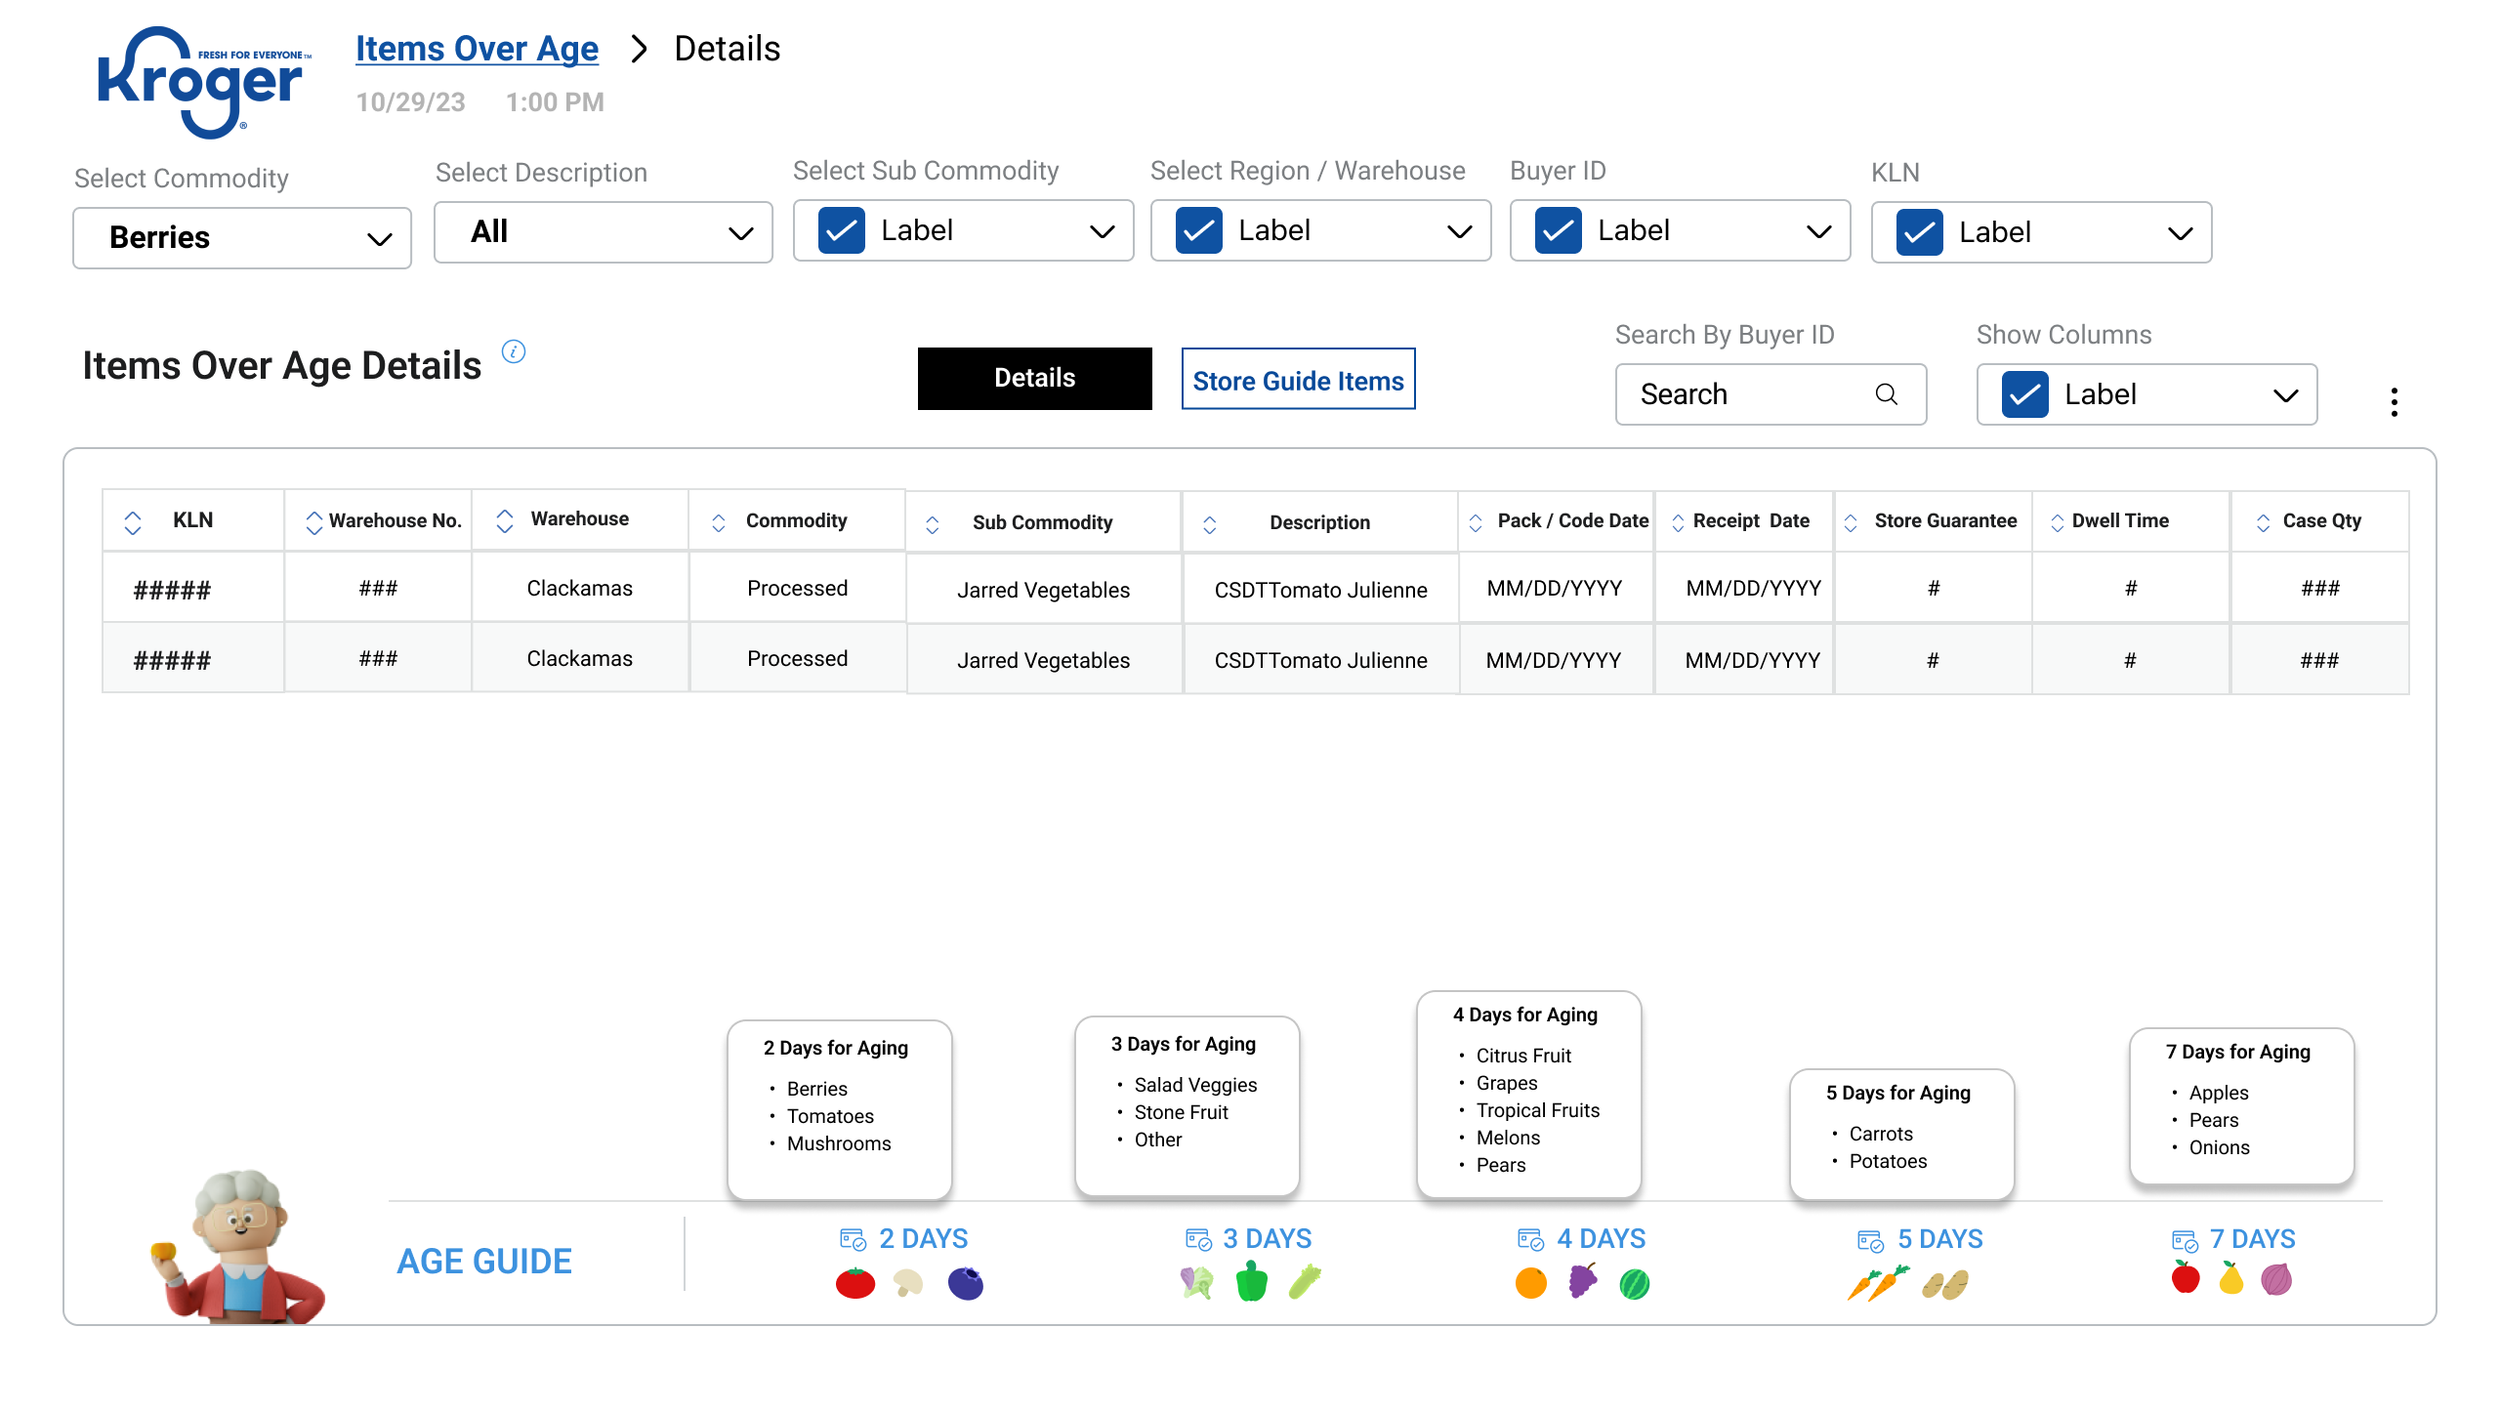
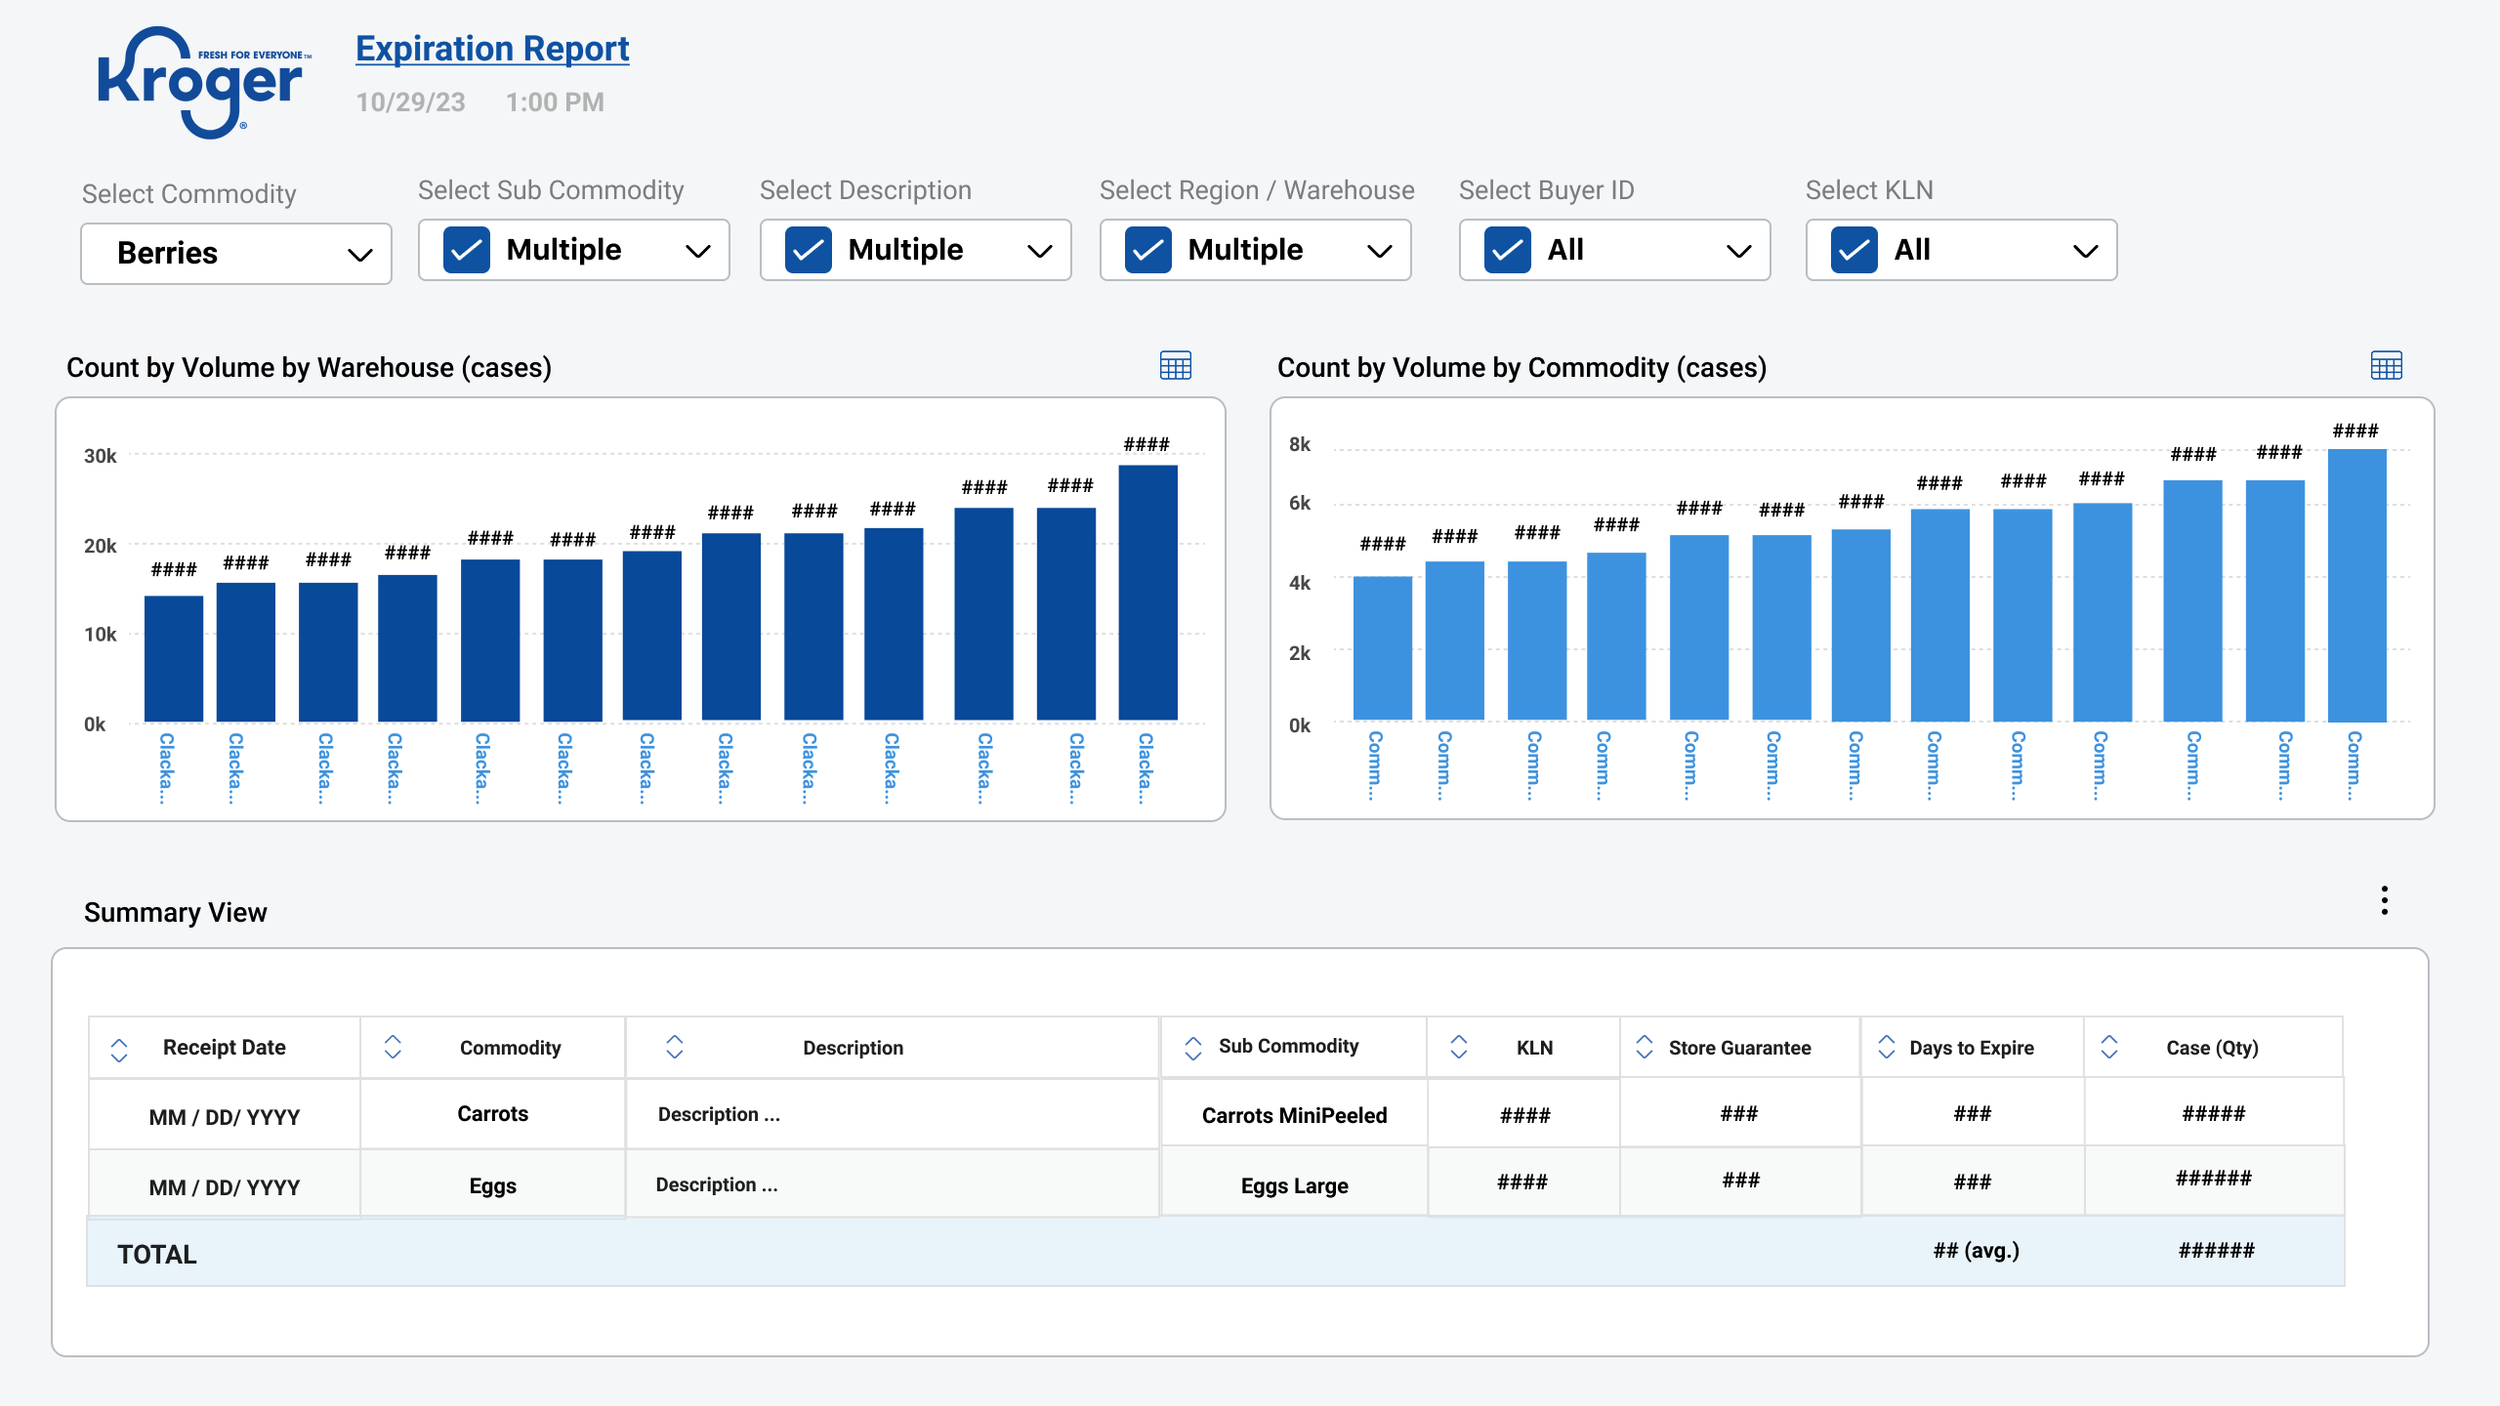
We were able to design a layout that showed the data in a easy fashion by volume along with a drill in o the data with the expiration guide to determine what has expired vs. what is a possibility to expire.
AFTER
I asked two primary questions:
Would you prefer to see a different design or layout for this report?
If you could change the design, what information, structure, or visualizations would you like to see?
Key Findings:
The majority of participants felt there was too much information displayed on the screen and expressed a desire for better organization, structure, and hierarchy.
Several users indicated they were accustomed to the existing reporting format and didn't necessarily recognize the opportunities for improvement.
A smaller group felt the current design was sufficient, highlighting an opportunity to introduce users to more effective ways of presenting data and improving their overall reporting experience.
Conducted a Card Sorting Activity
Executive Level
"Market Share
Promise Shop" They are both executive level metrics for our stakeholders.
Vendor Level
Fill Rate vs. Adj. Fill Rate
Inbound Cold Chain
Quality Score These all have to do with the vendor/supplier performance.
DC Level
Aging
DC DOS
Order vs. Ship
Outbound Cold Chain These all have to do with our Fresh DCs.
Store Level
Sales Data
Store DOS
These both have to do with our stores.
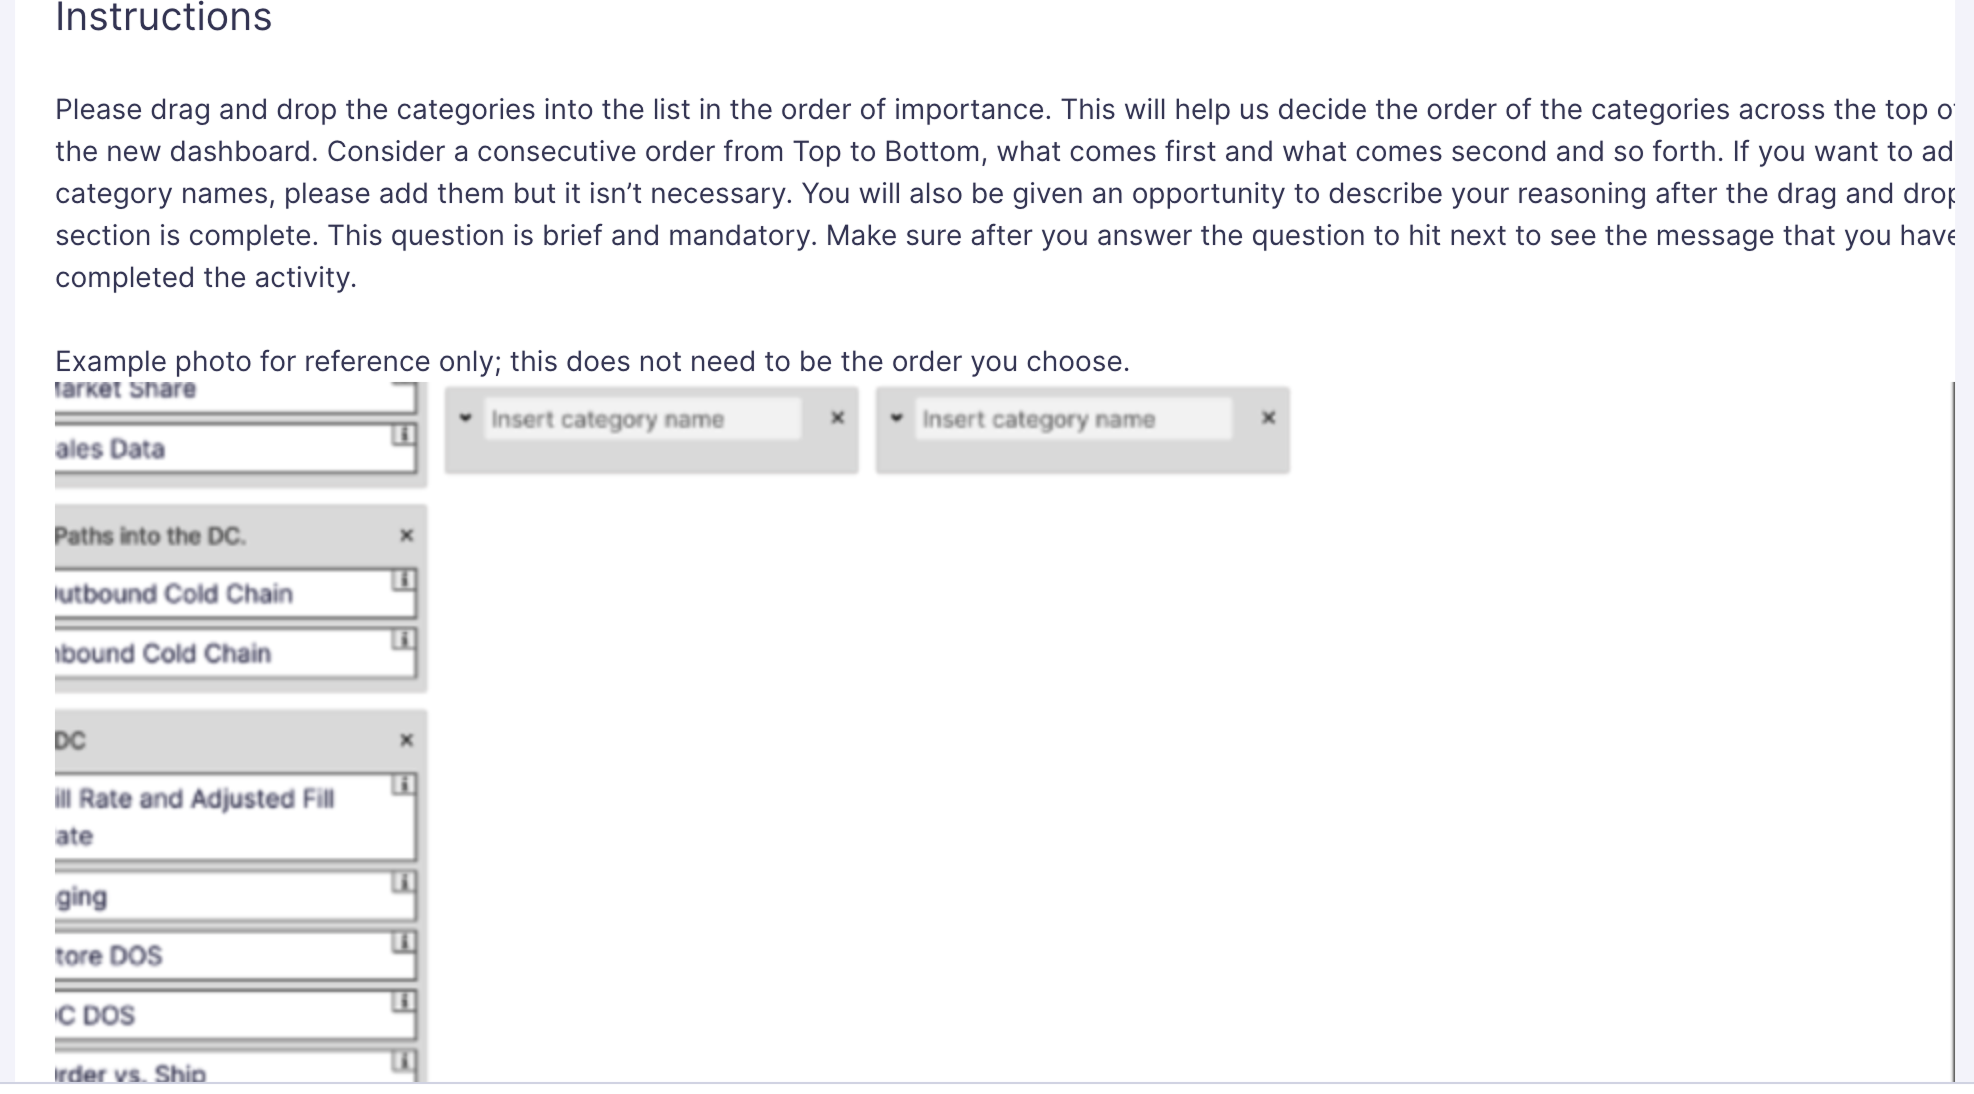
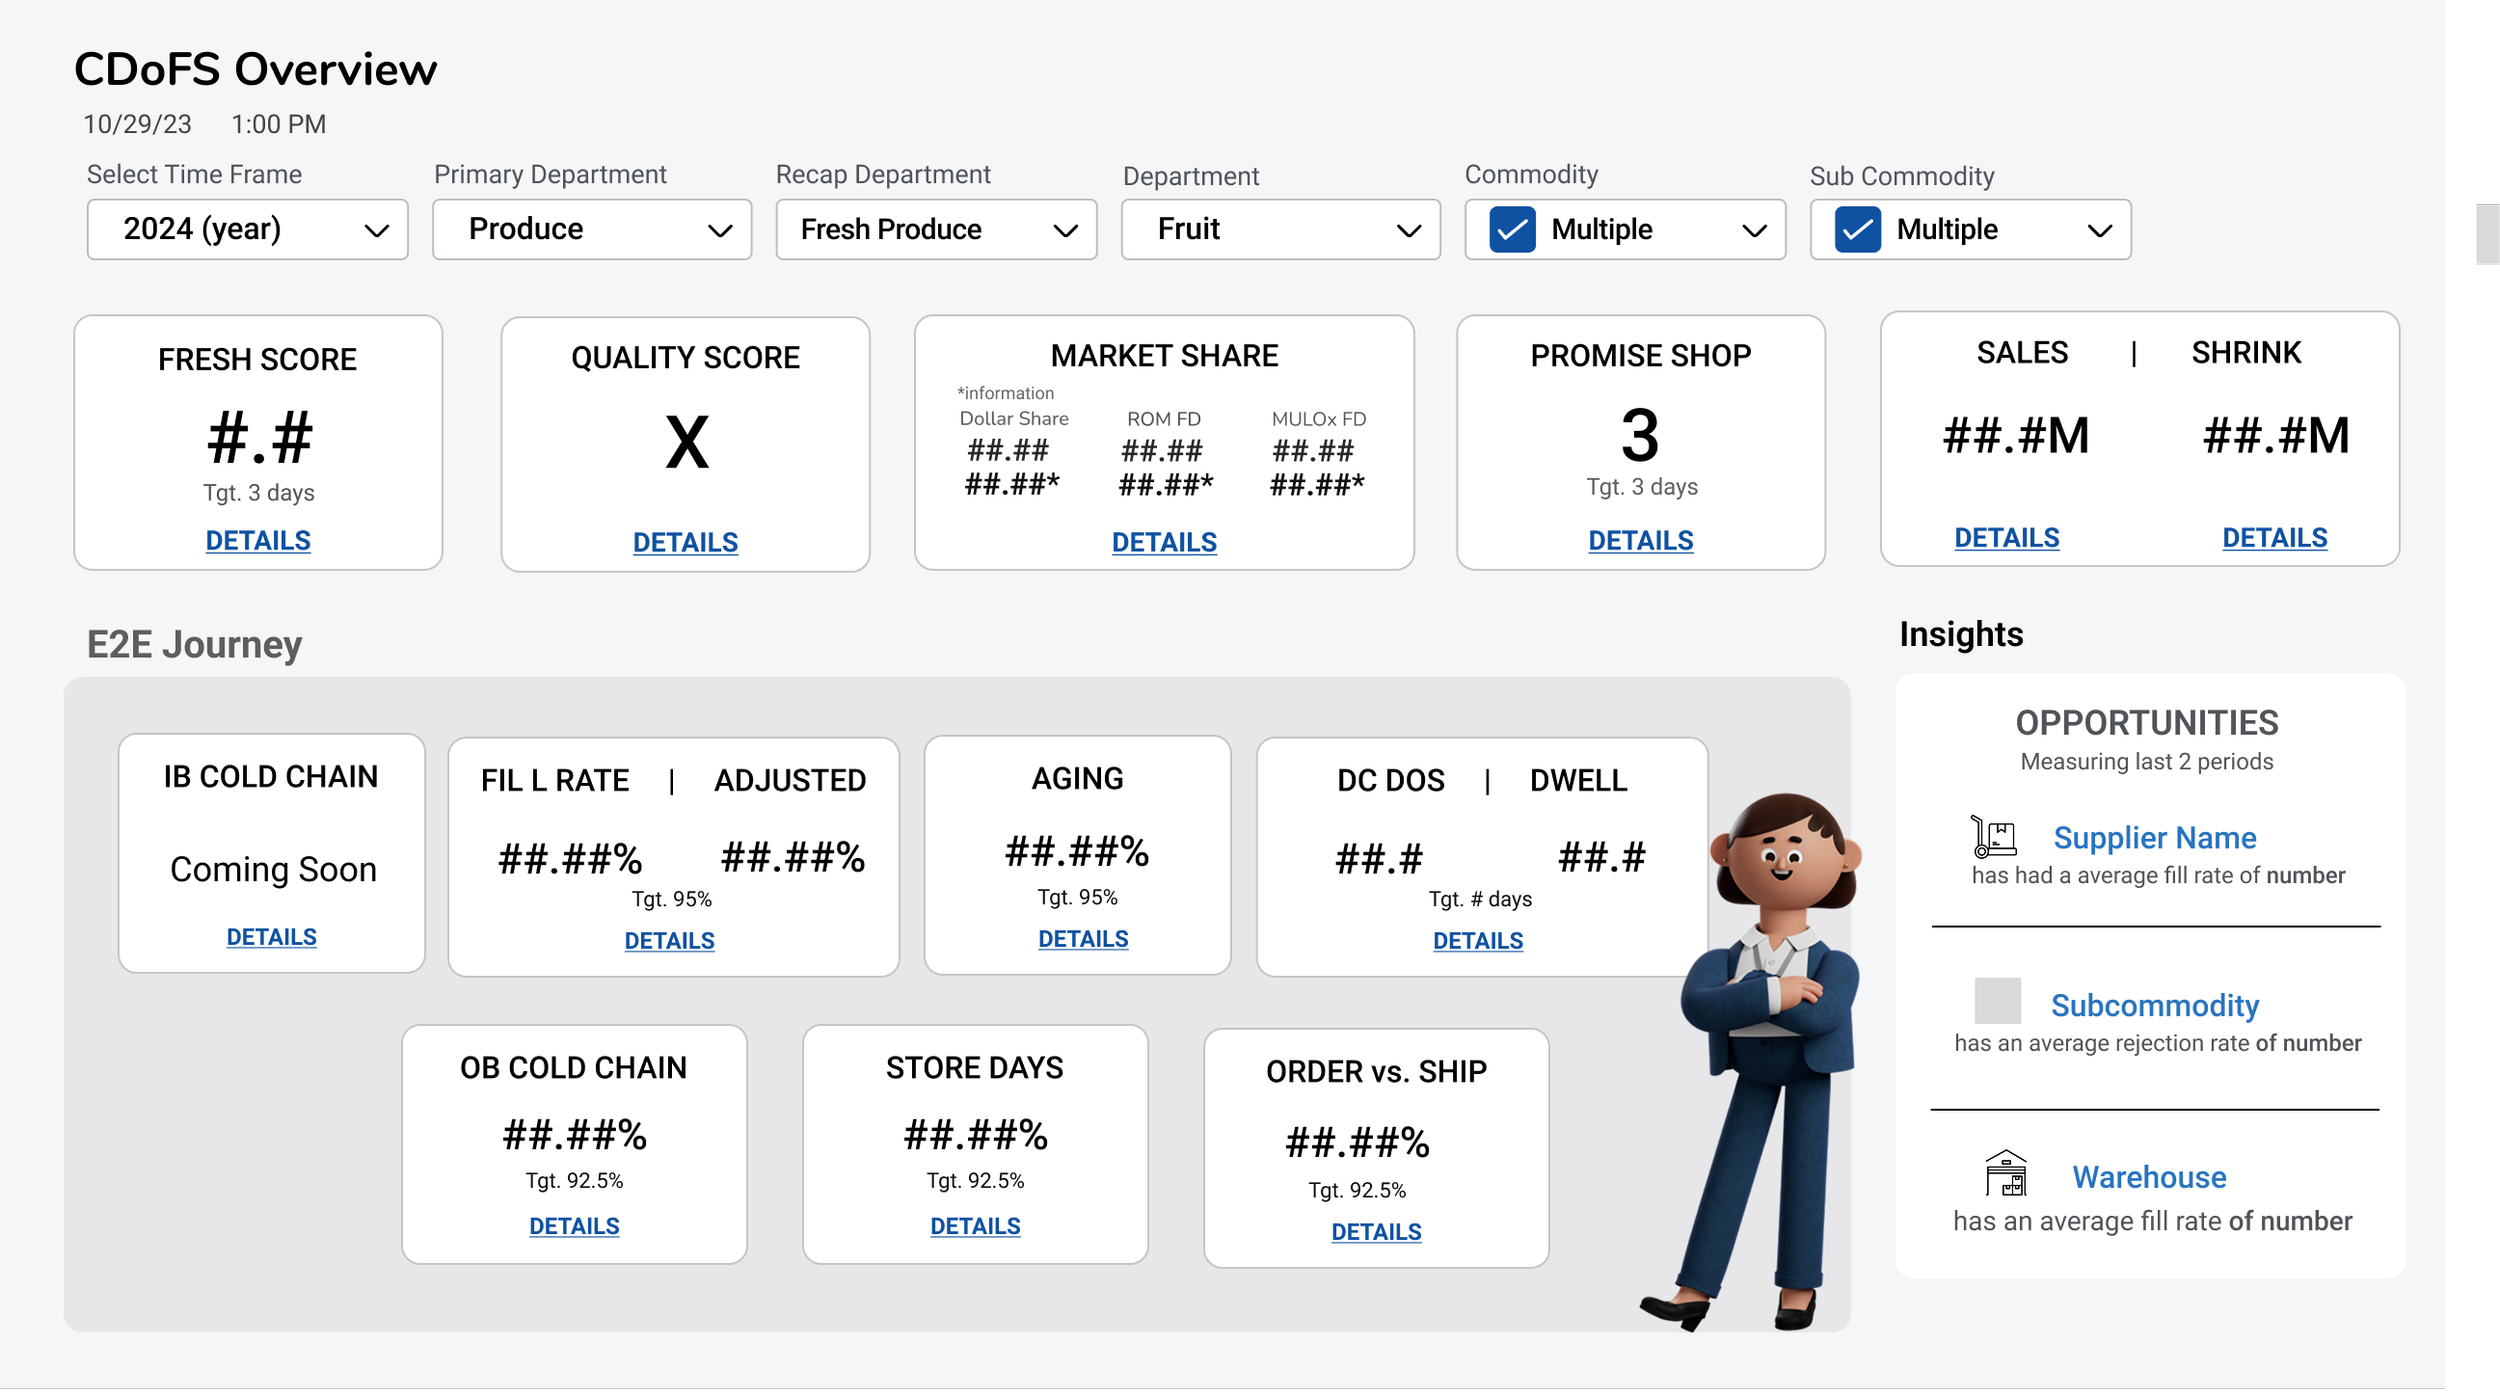
I explored approximately four design iterations, working closely with the Product Manager to evaluate the data and determine which information would be most valuable to display. During those discussions, we identified that the Opportunities option would ultimately direct users to a separate destination, so we decided to remove it from the experience. This allowed us to simplify the interface, create more breathing room, and establish a stronger visual hierarchy around the key Freshness metrics users needed to make quick, informed business decisions.
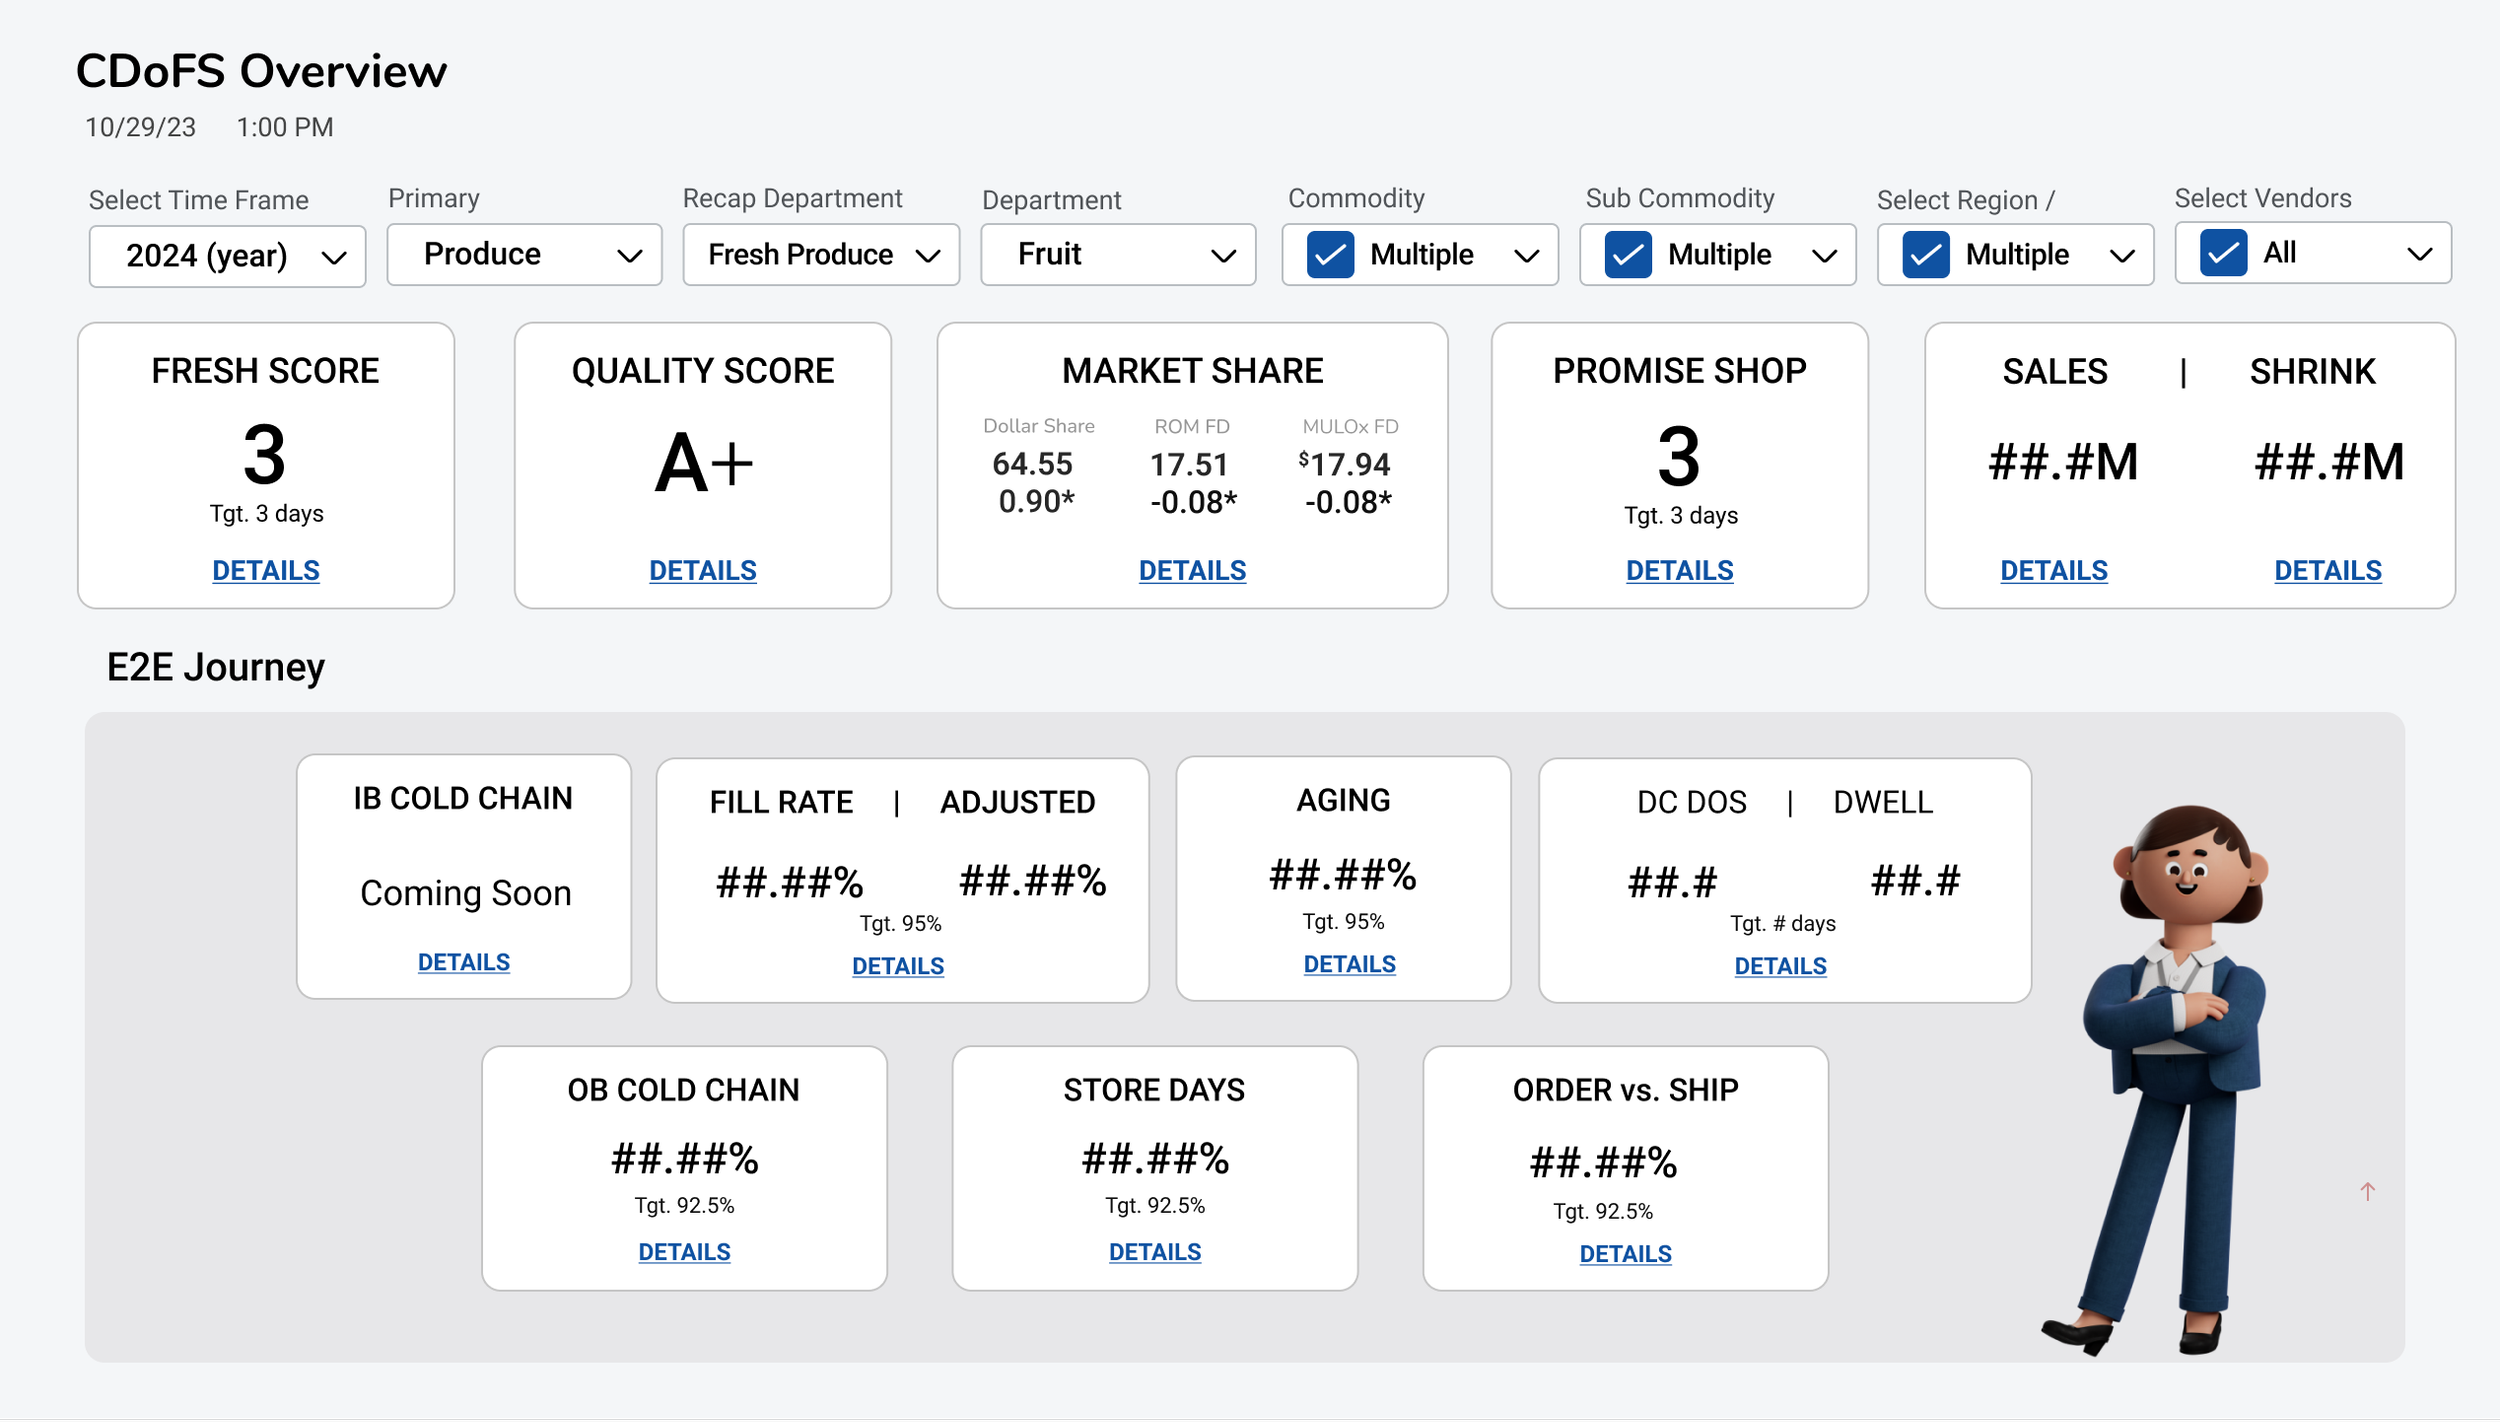
Product Team was able to:
Increase users’ time and efficiency by over 40% by having the ability to display a hierarchy of data in real time to track Produce Freshness and Sales
Increased business revenue by 30% by creating a display that provides real time data on Produce Freshness and Sales
4 out of the 7 users broke down the categories into Executive Level + Vendor and DC level
This helped drive the hierarchy of design
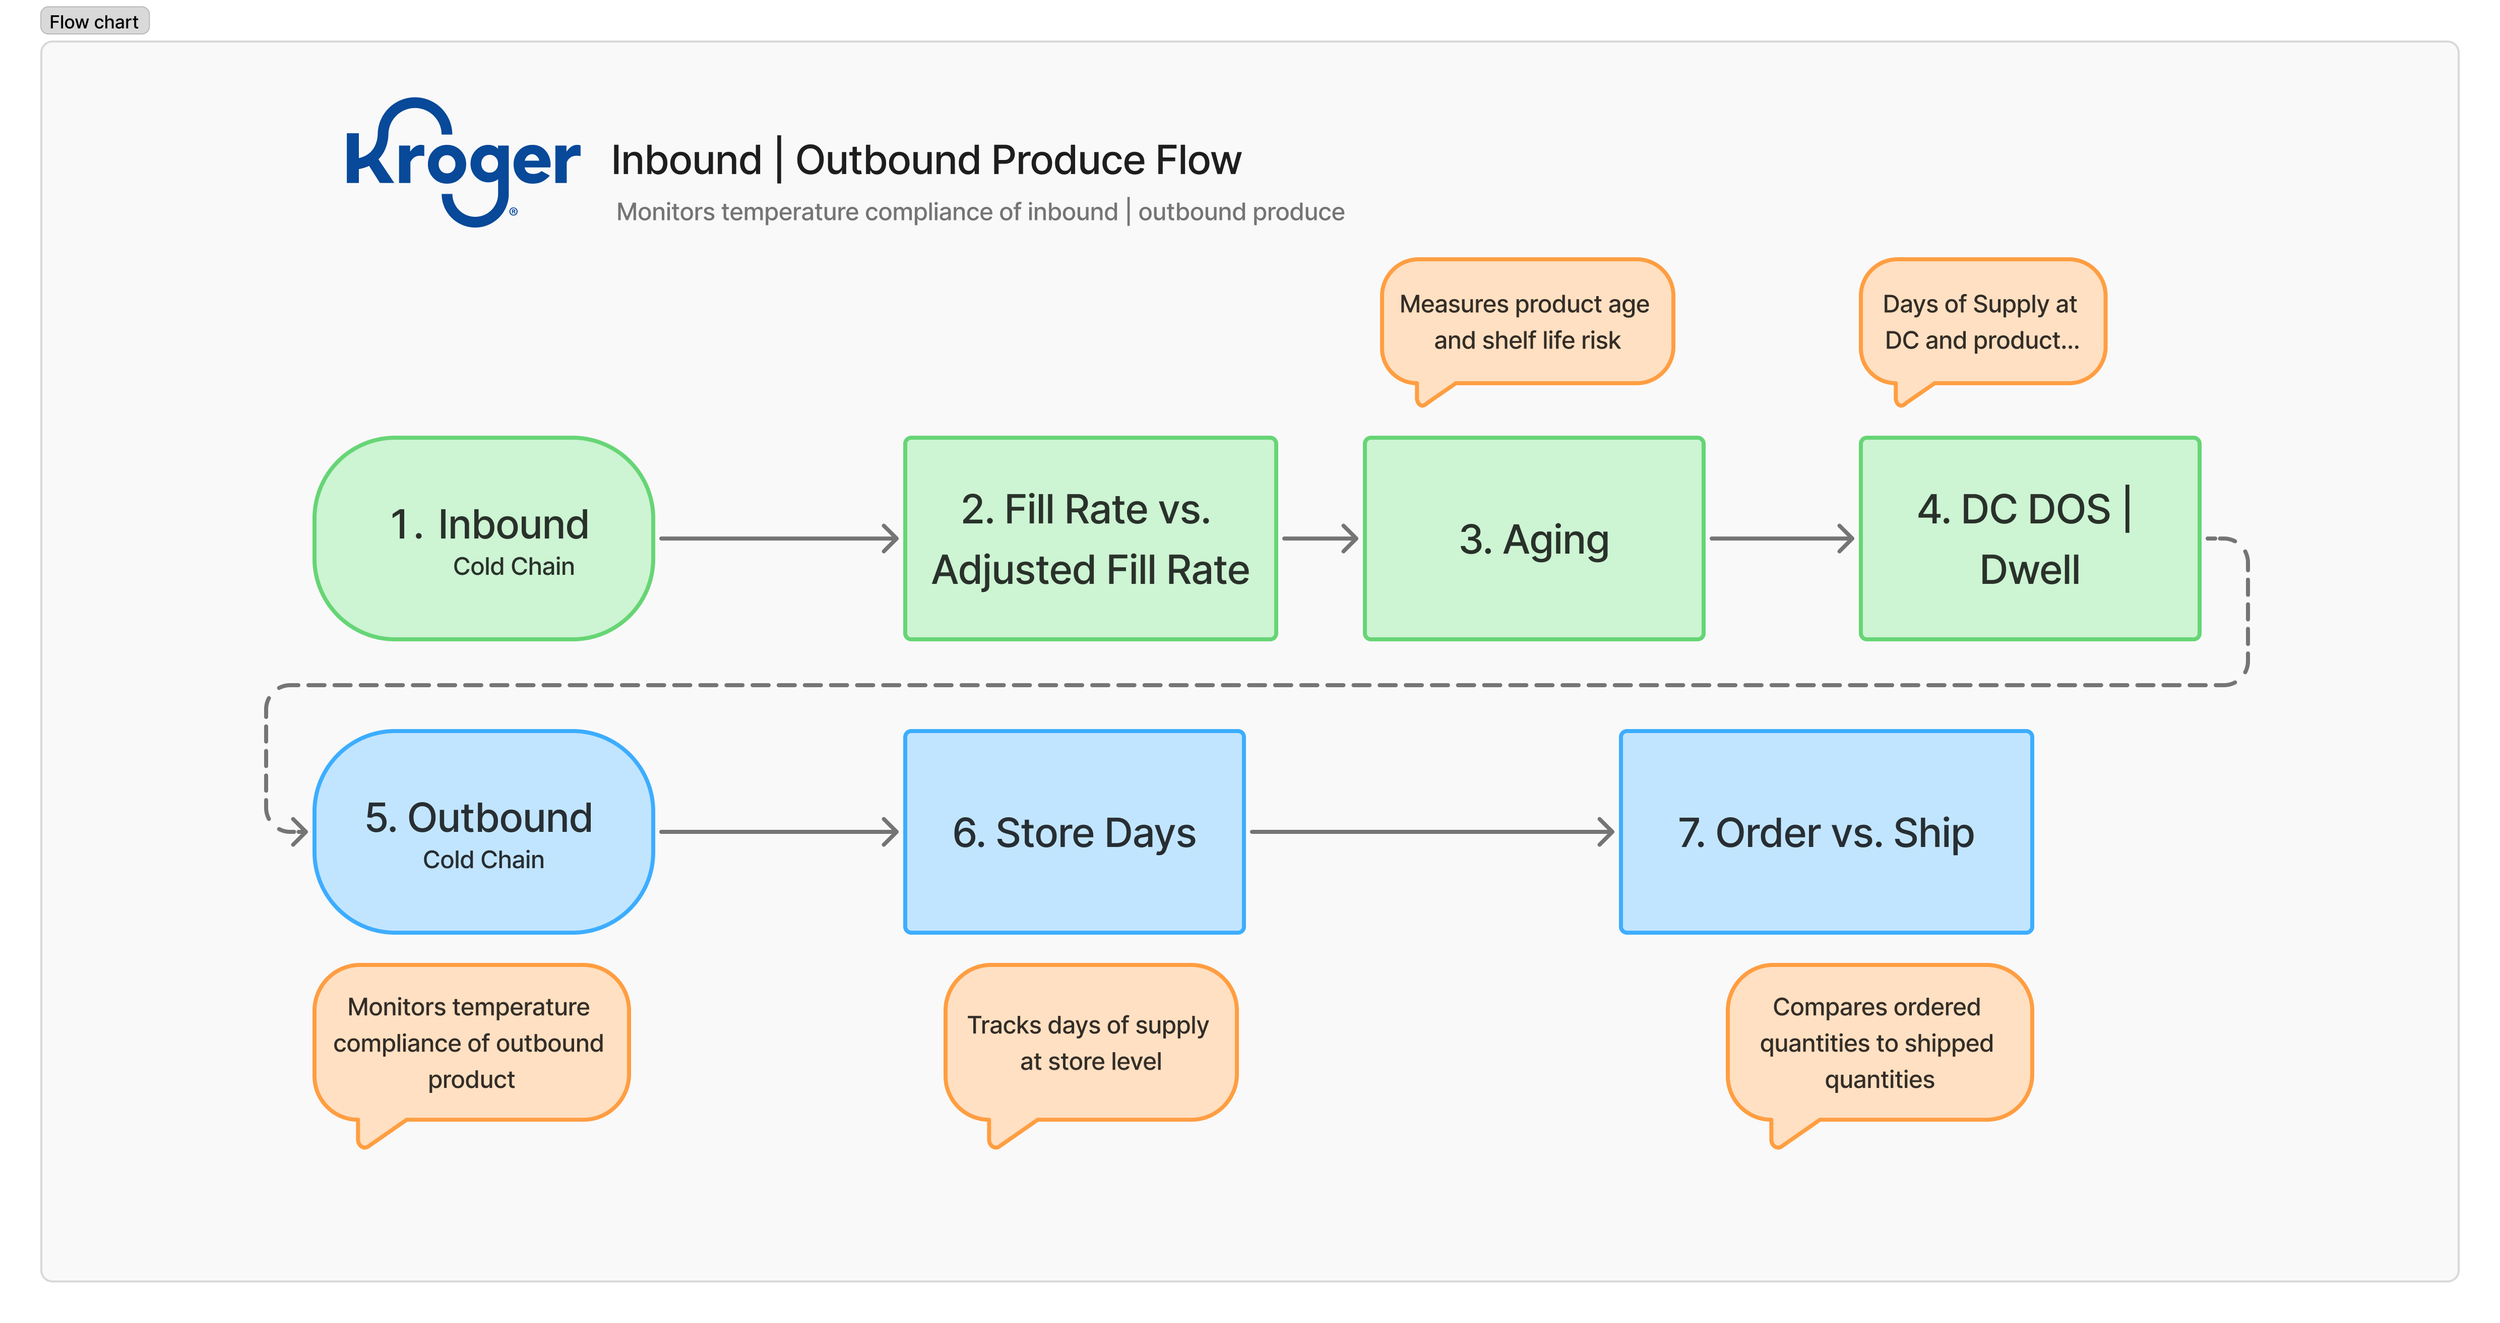
We were able to agree on user flows based on existing knowledge of inbound and outbound flows
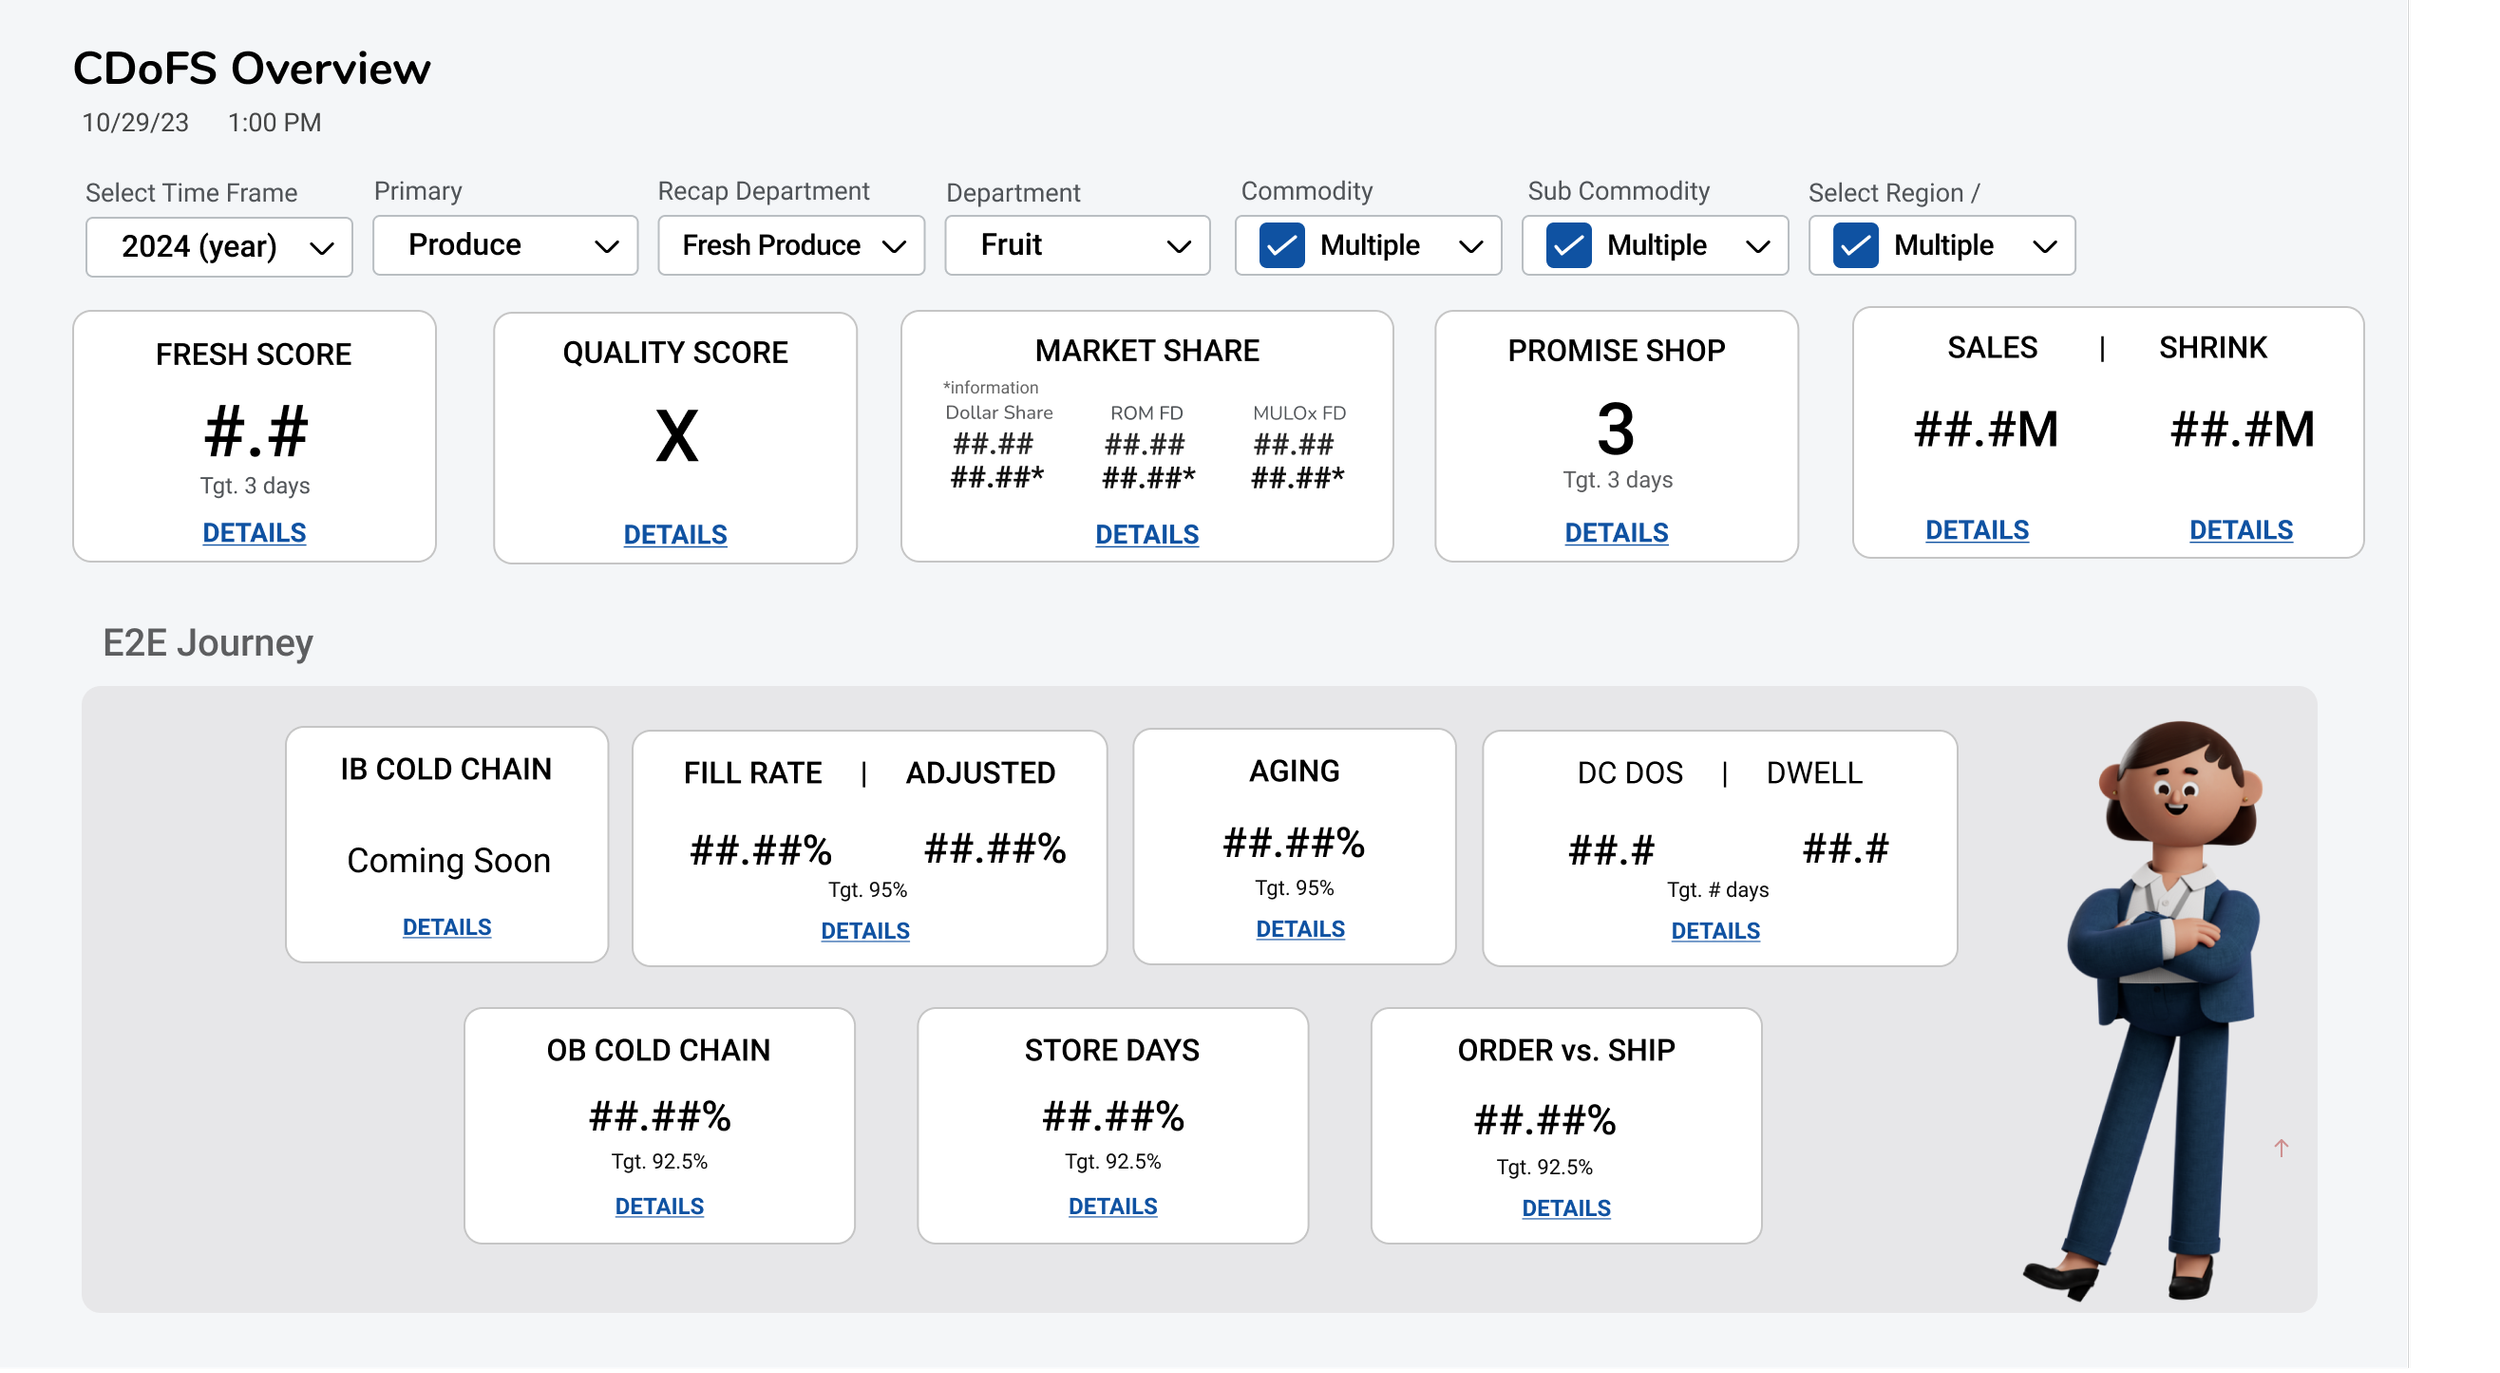
Results
Based on the following knowledge and card sorting results, I was able to design several designs that established hierarchy based on users needs, with Enterprise Data vs. the E2E Produce Journey.
Conducted Testing
Results
5 out of the 7 wanted to the Enterprise Data at the top and E2E Journey below
Insights they DID want to display however we stated it will be displayed
in another screen due to data hierarchy and overall report data hierarchy