
Kroger Grocery: B2B Fresh Initiative
Step 1. I interviewed Users to understand their day to day and pain points along with the systems they were using.
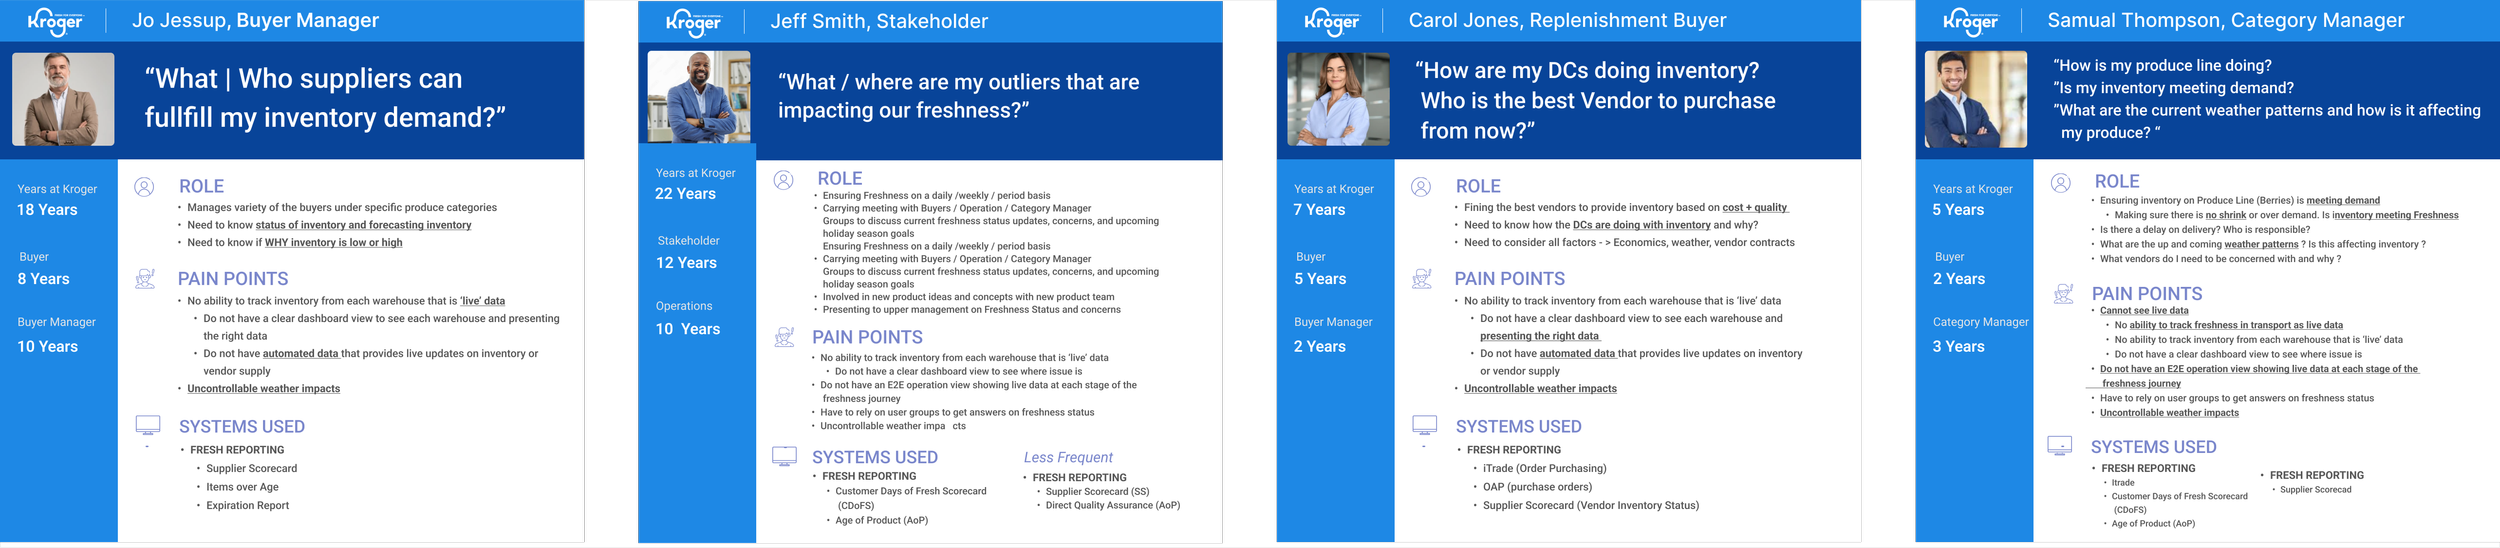
Overall Problem
Users needed one application to be able to track produce from the day it was picked to the day it was received to the customer. This was called the “Kroger Fresh Initiative.”
At the time users were manually creating reports from existing backend systems. causing frustration on our users due the time and effort to find the right data, and from which system and sometimes the data was ALSO prone to error.
By having a one stop shop to be able to read data for our users' Fresh Initiative, users would be able to make quick, efficient business decisions on produce tracking for the Fresh Initiative goals
Step 2. Conducted a Heuristic Evaluation on the existing pilot to understand loopholes with the UX and how we can do better.

Step 2: Results
All the reports had to be accessed in different URLs
Alll the reports had inconsistencies all over
Page navigation
Filtering
Design
Some of the data was incorrect
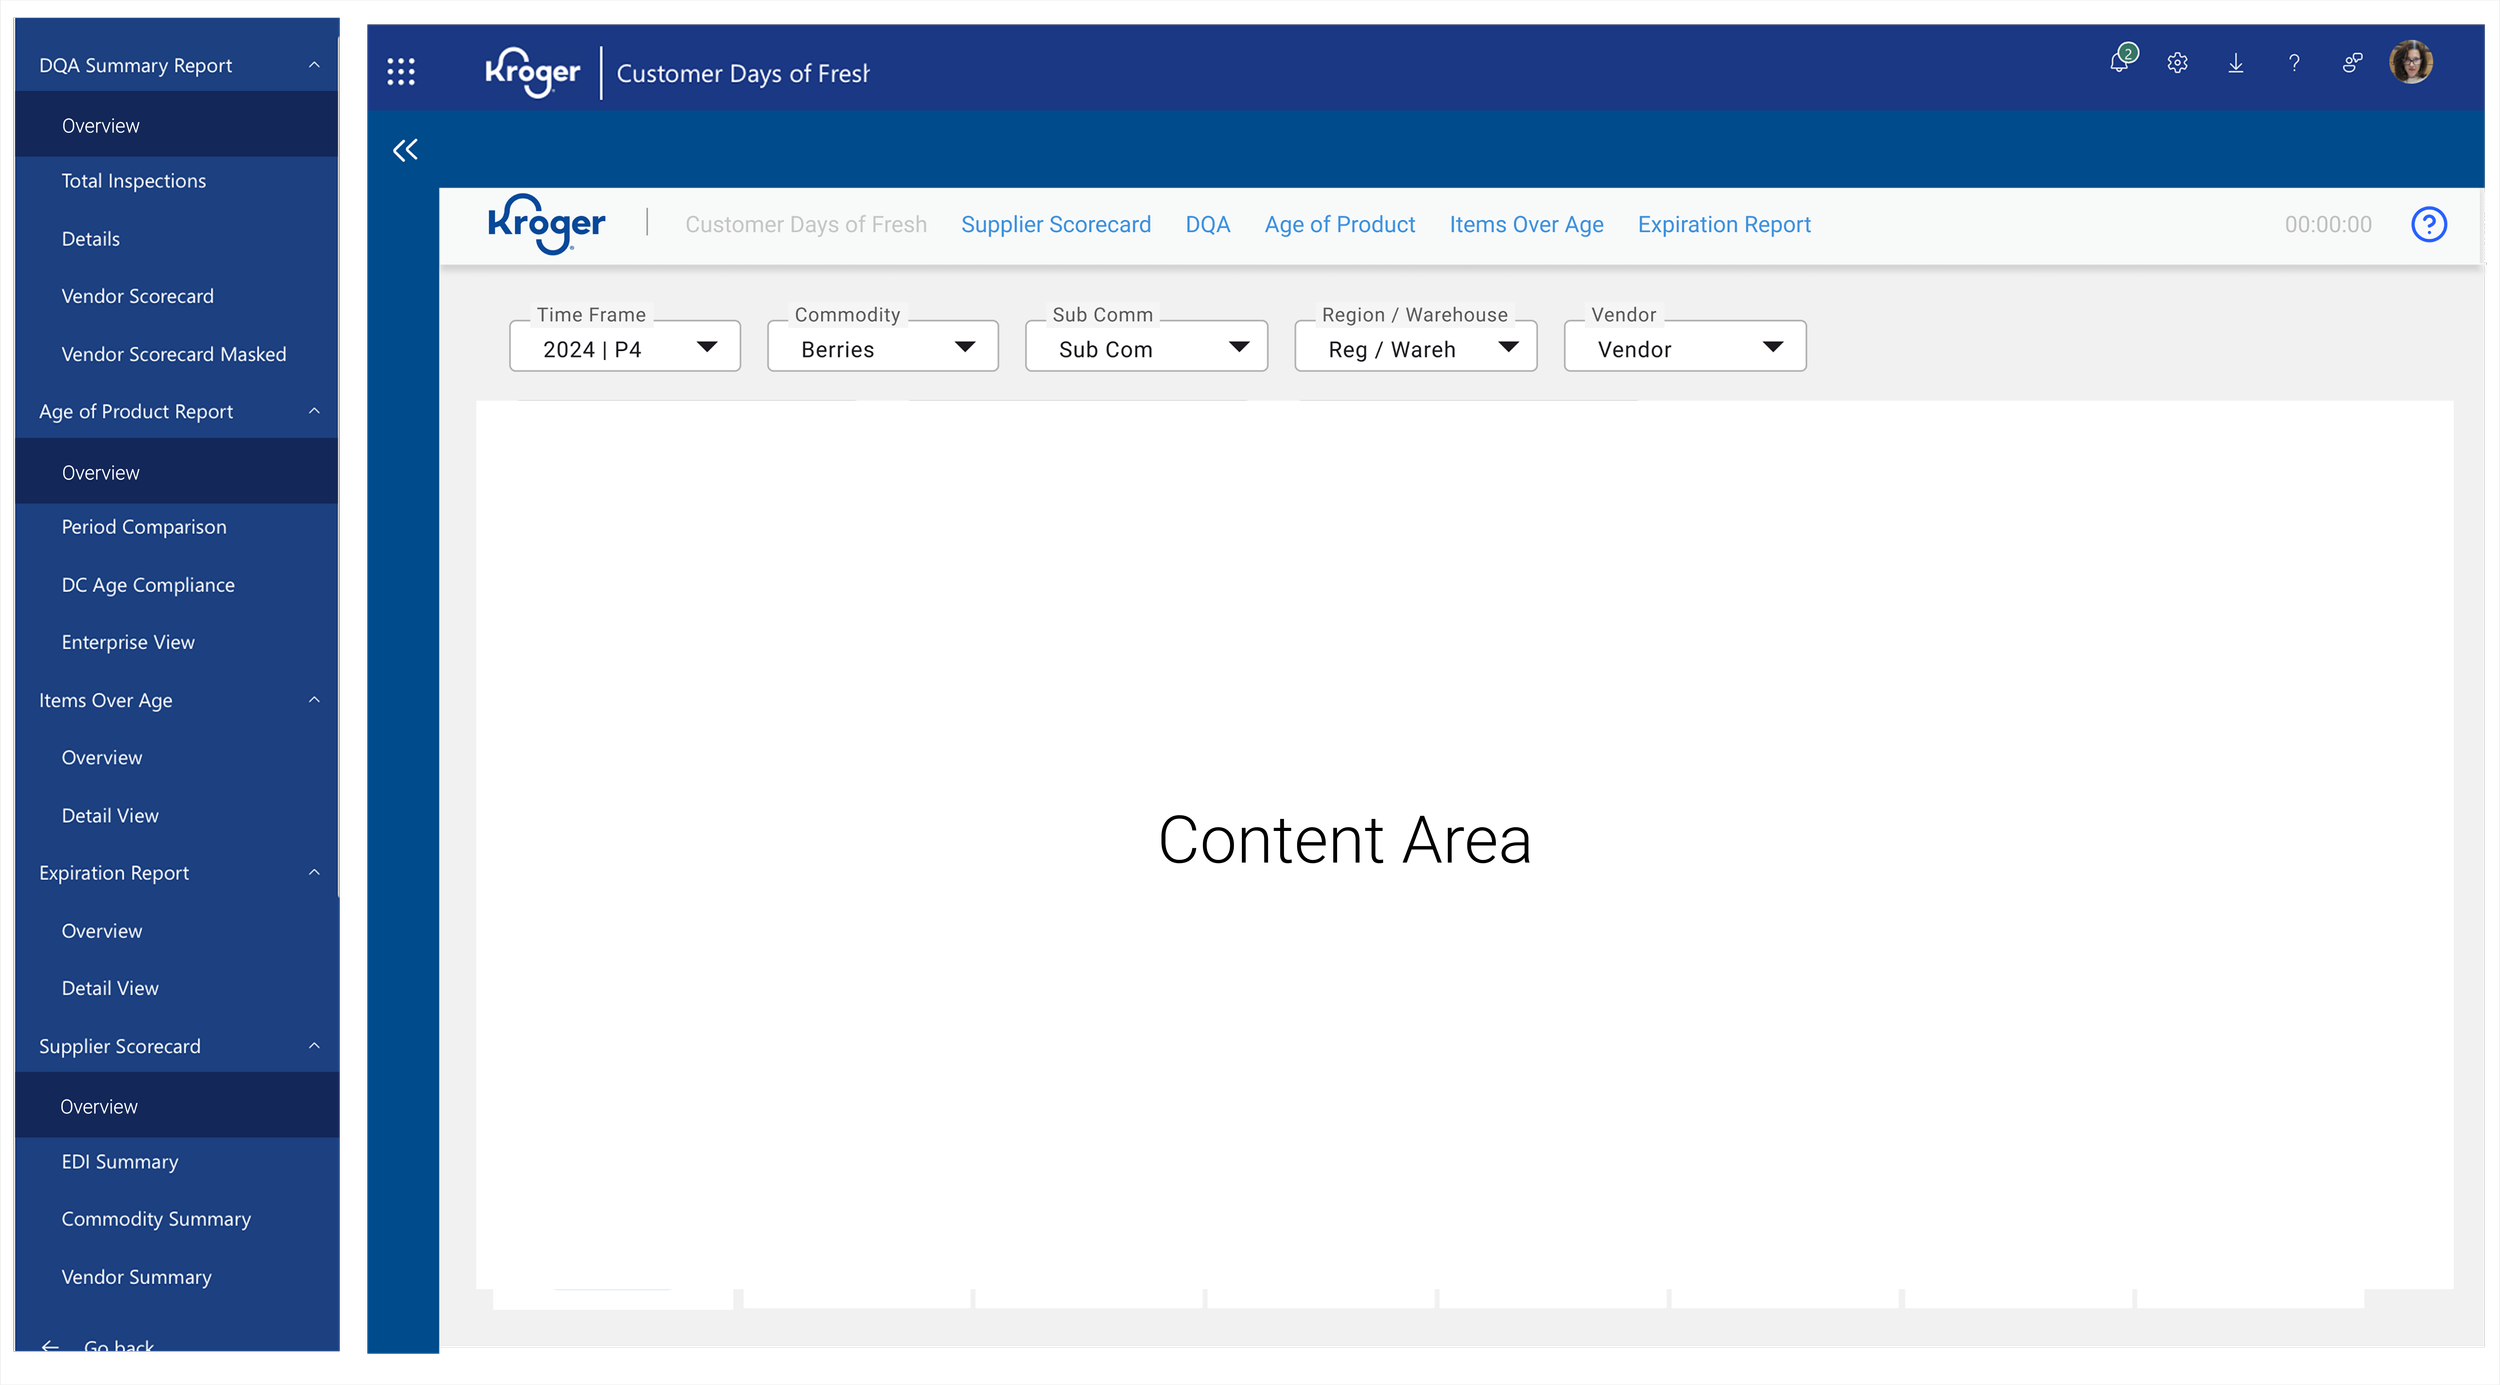
I was able to created a navigation system and framework that spoke to the Kroger brand and navigational hierarchy that spoke to the needs to users and the E2E Freshness Initiative
Note: Some of the UX was standard with Copilot , as a result I partnered closely with engineers prior to design to ensure what I could do was feasible.
Step 3: I Conducted Usability Testing.
I wanted to see if Users were using the existing platform effectively
40% of Users did not know how to use the platform effectively or efficiently
Unaware of features that could make their time and day to day more efficient and effective
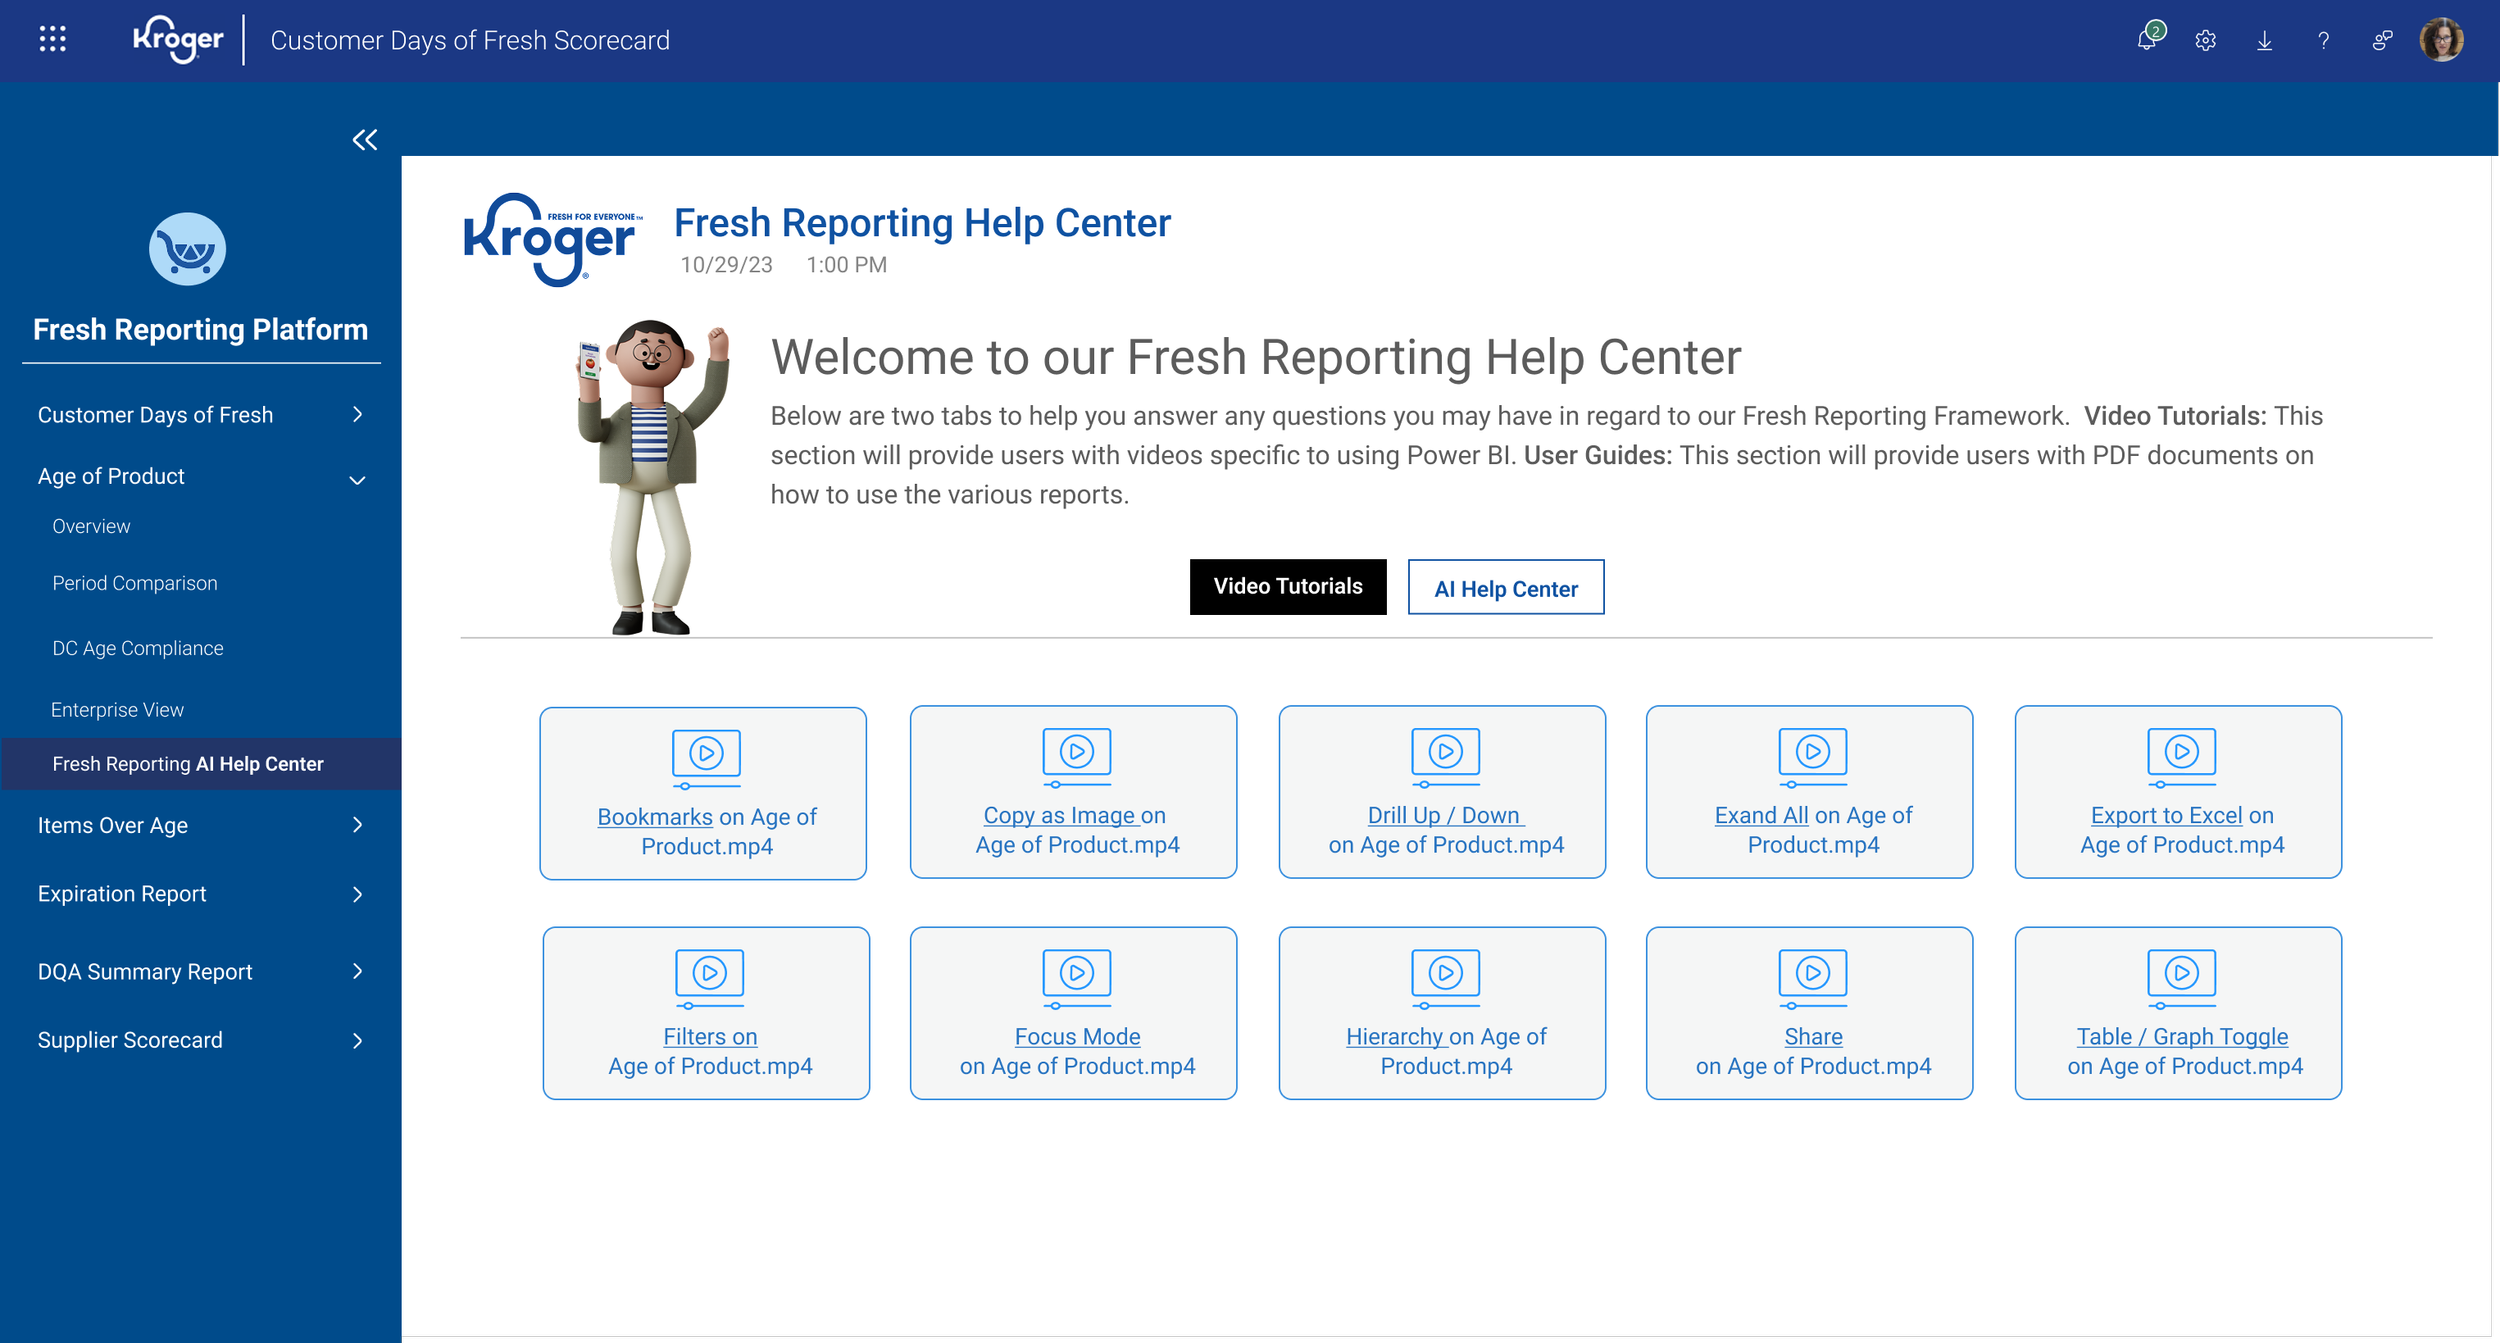
Results
I recommended to the product team to lets build a video section of quick how to’s to help users with various workflows: Downloading Reports, sharing reports and so forth.
I designed the interface and partnered with engineering to help test each video to ensure it was clear, concise, and paced.
I was able to design Help Center Sections for all reports that not only increased users time and efficient in using the product by over 30%, users were also able to use these for training new colleagues while also building a trust with our product team.
Step 4 (iterartive): Conducting iterative discovery sessions with our users for various reports.
Working closely with the Product Manager we conducted discovery sessions with our user groups to better understand their needs and wants
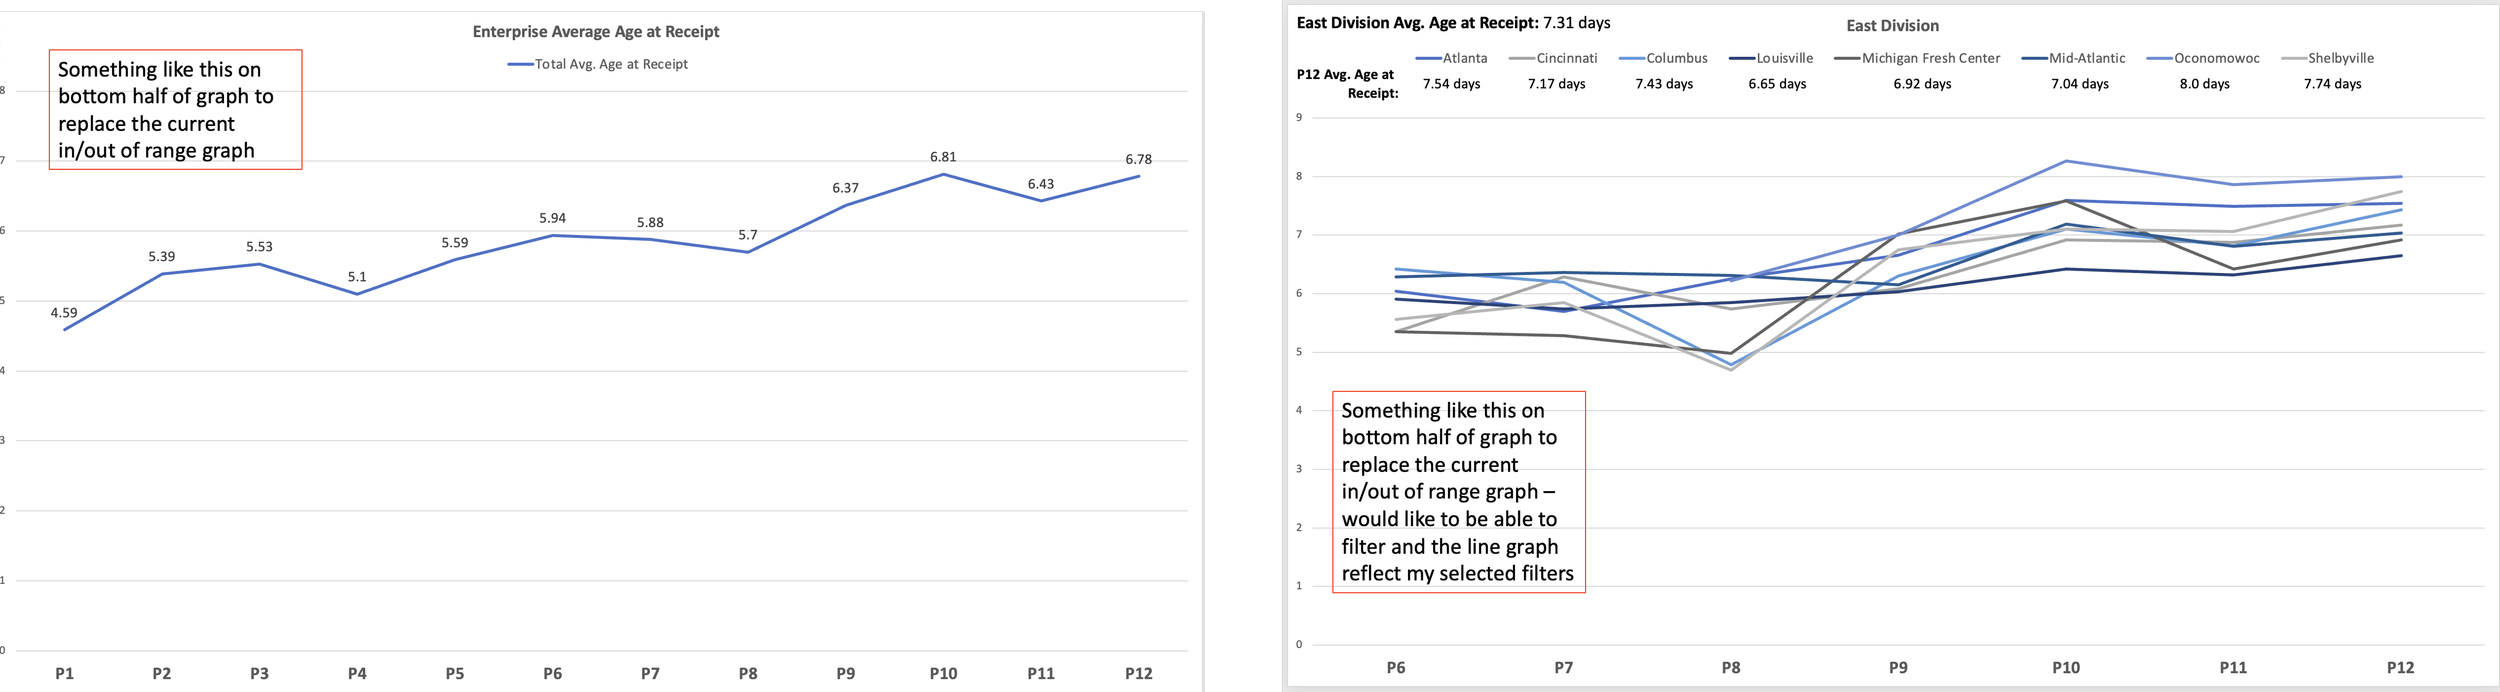
Aging Before
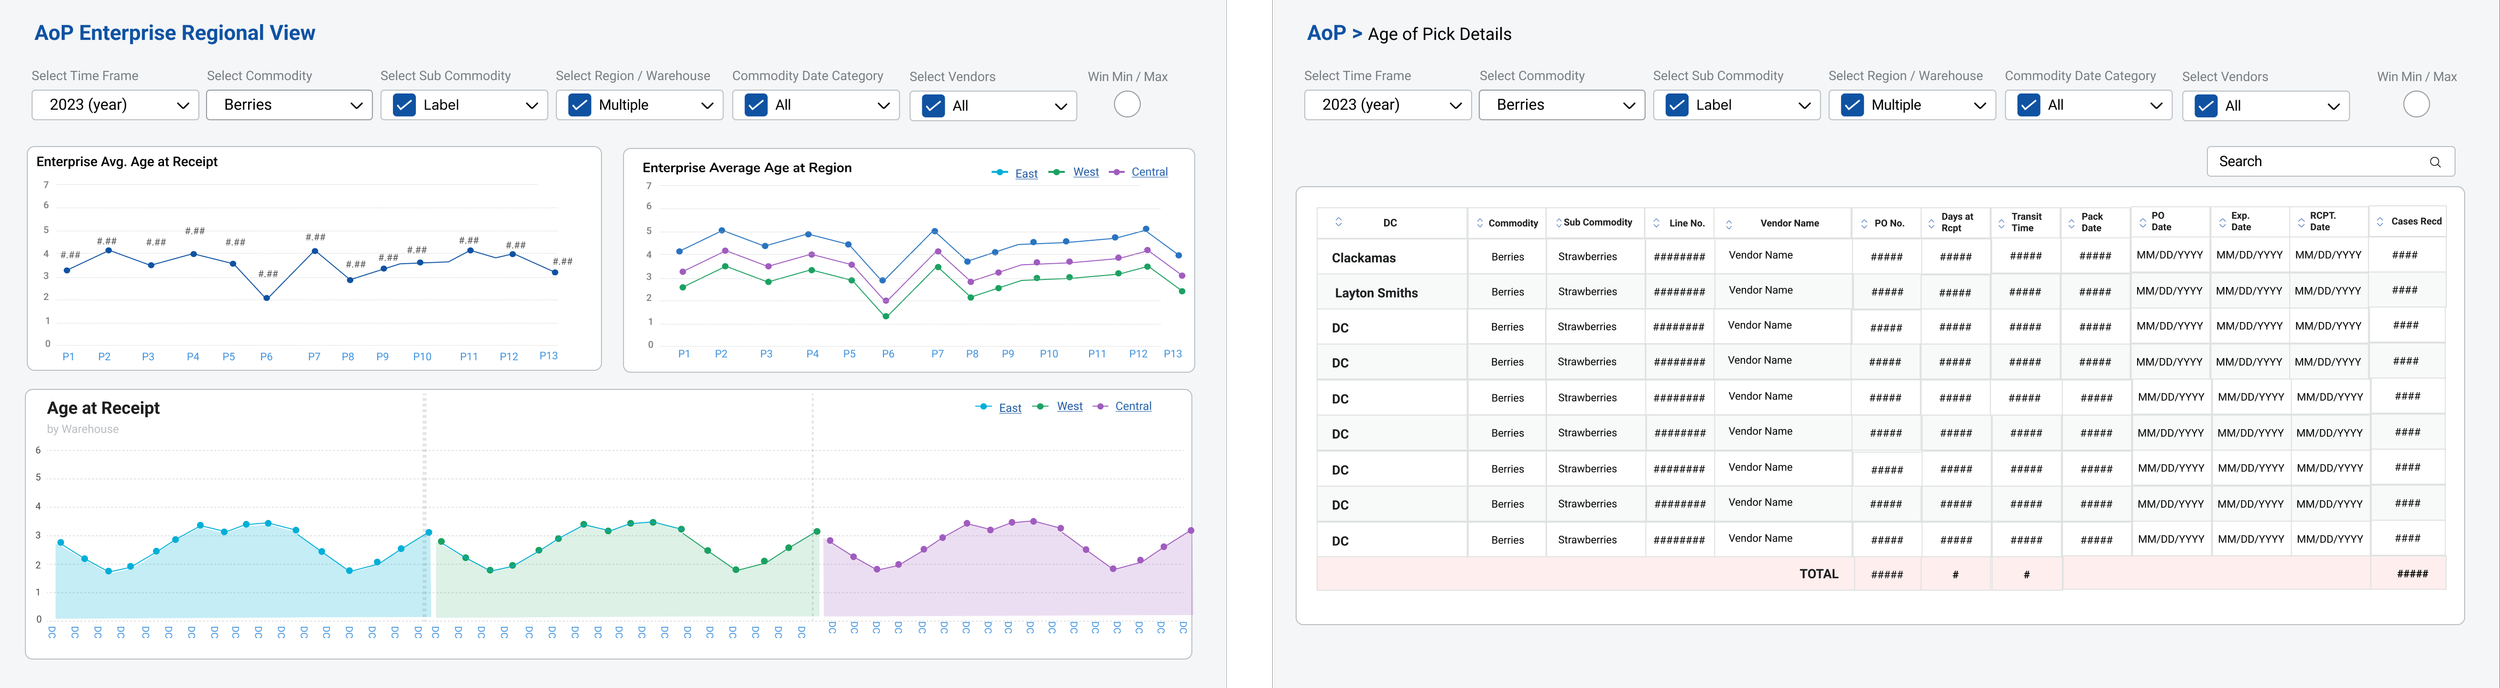
Aging After
Results
Based on our discovery session we were able to create reports that spoke to the needs of the end users
Created an enterprise and regional view of aging to see where vendors and produce were failing on freshness
Was able to create a detailed view of each report that provided volume and show shrink data
Increased users’ time and efficiency to get real-time answers by over 40%
Increased users’ trust in the product team by over 50% by conducting user sessions directly with them and showing results based on their needs.
There is a wealth more to this project, contact me directly to learn more about this project or any others at asmith@smithdezign.com
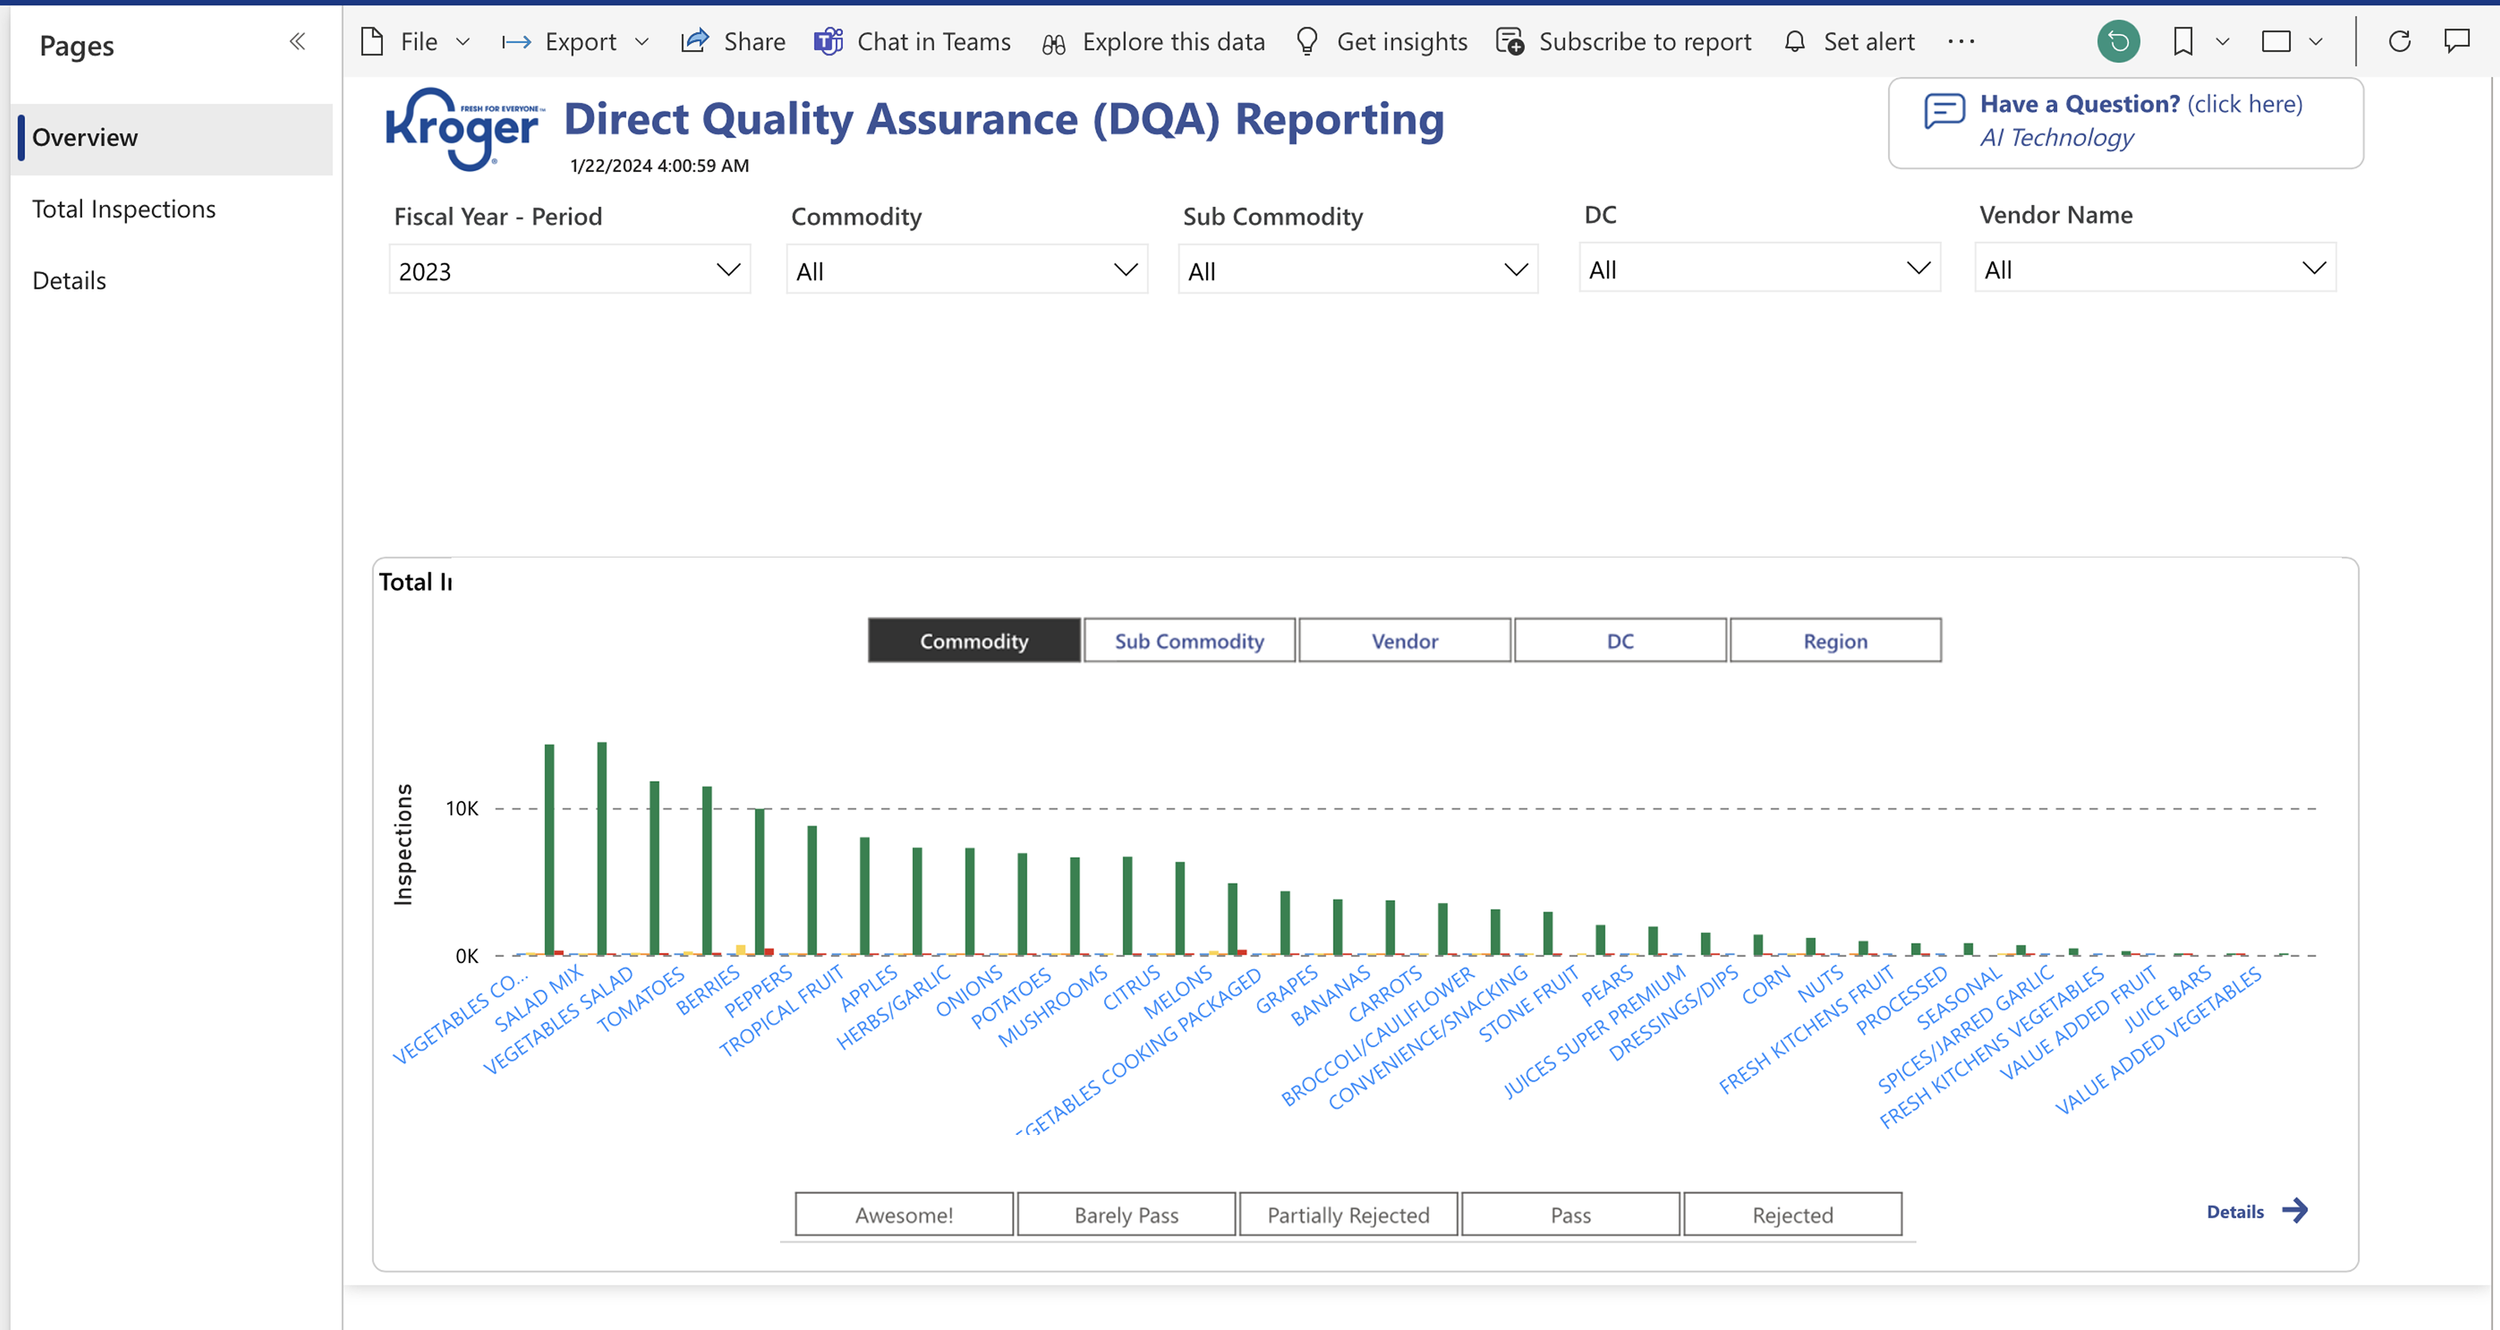
Direct Quality Assurance (DQA): Before
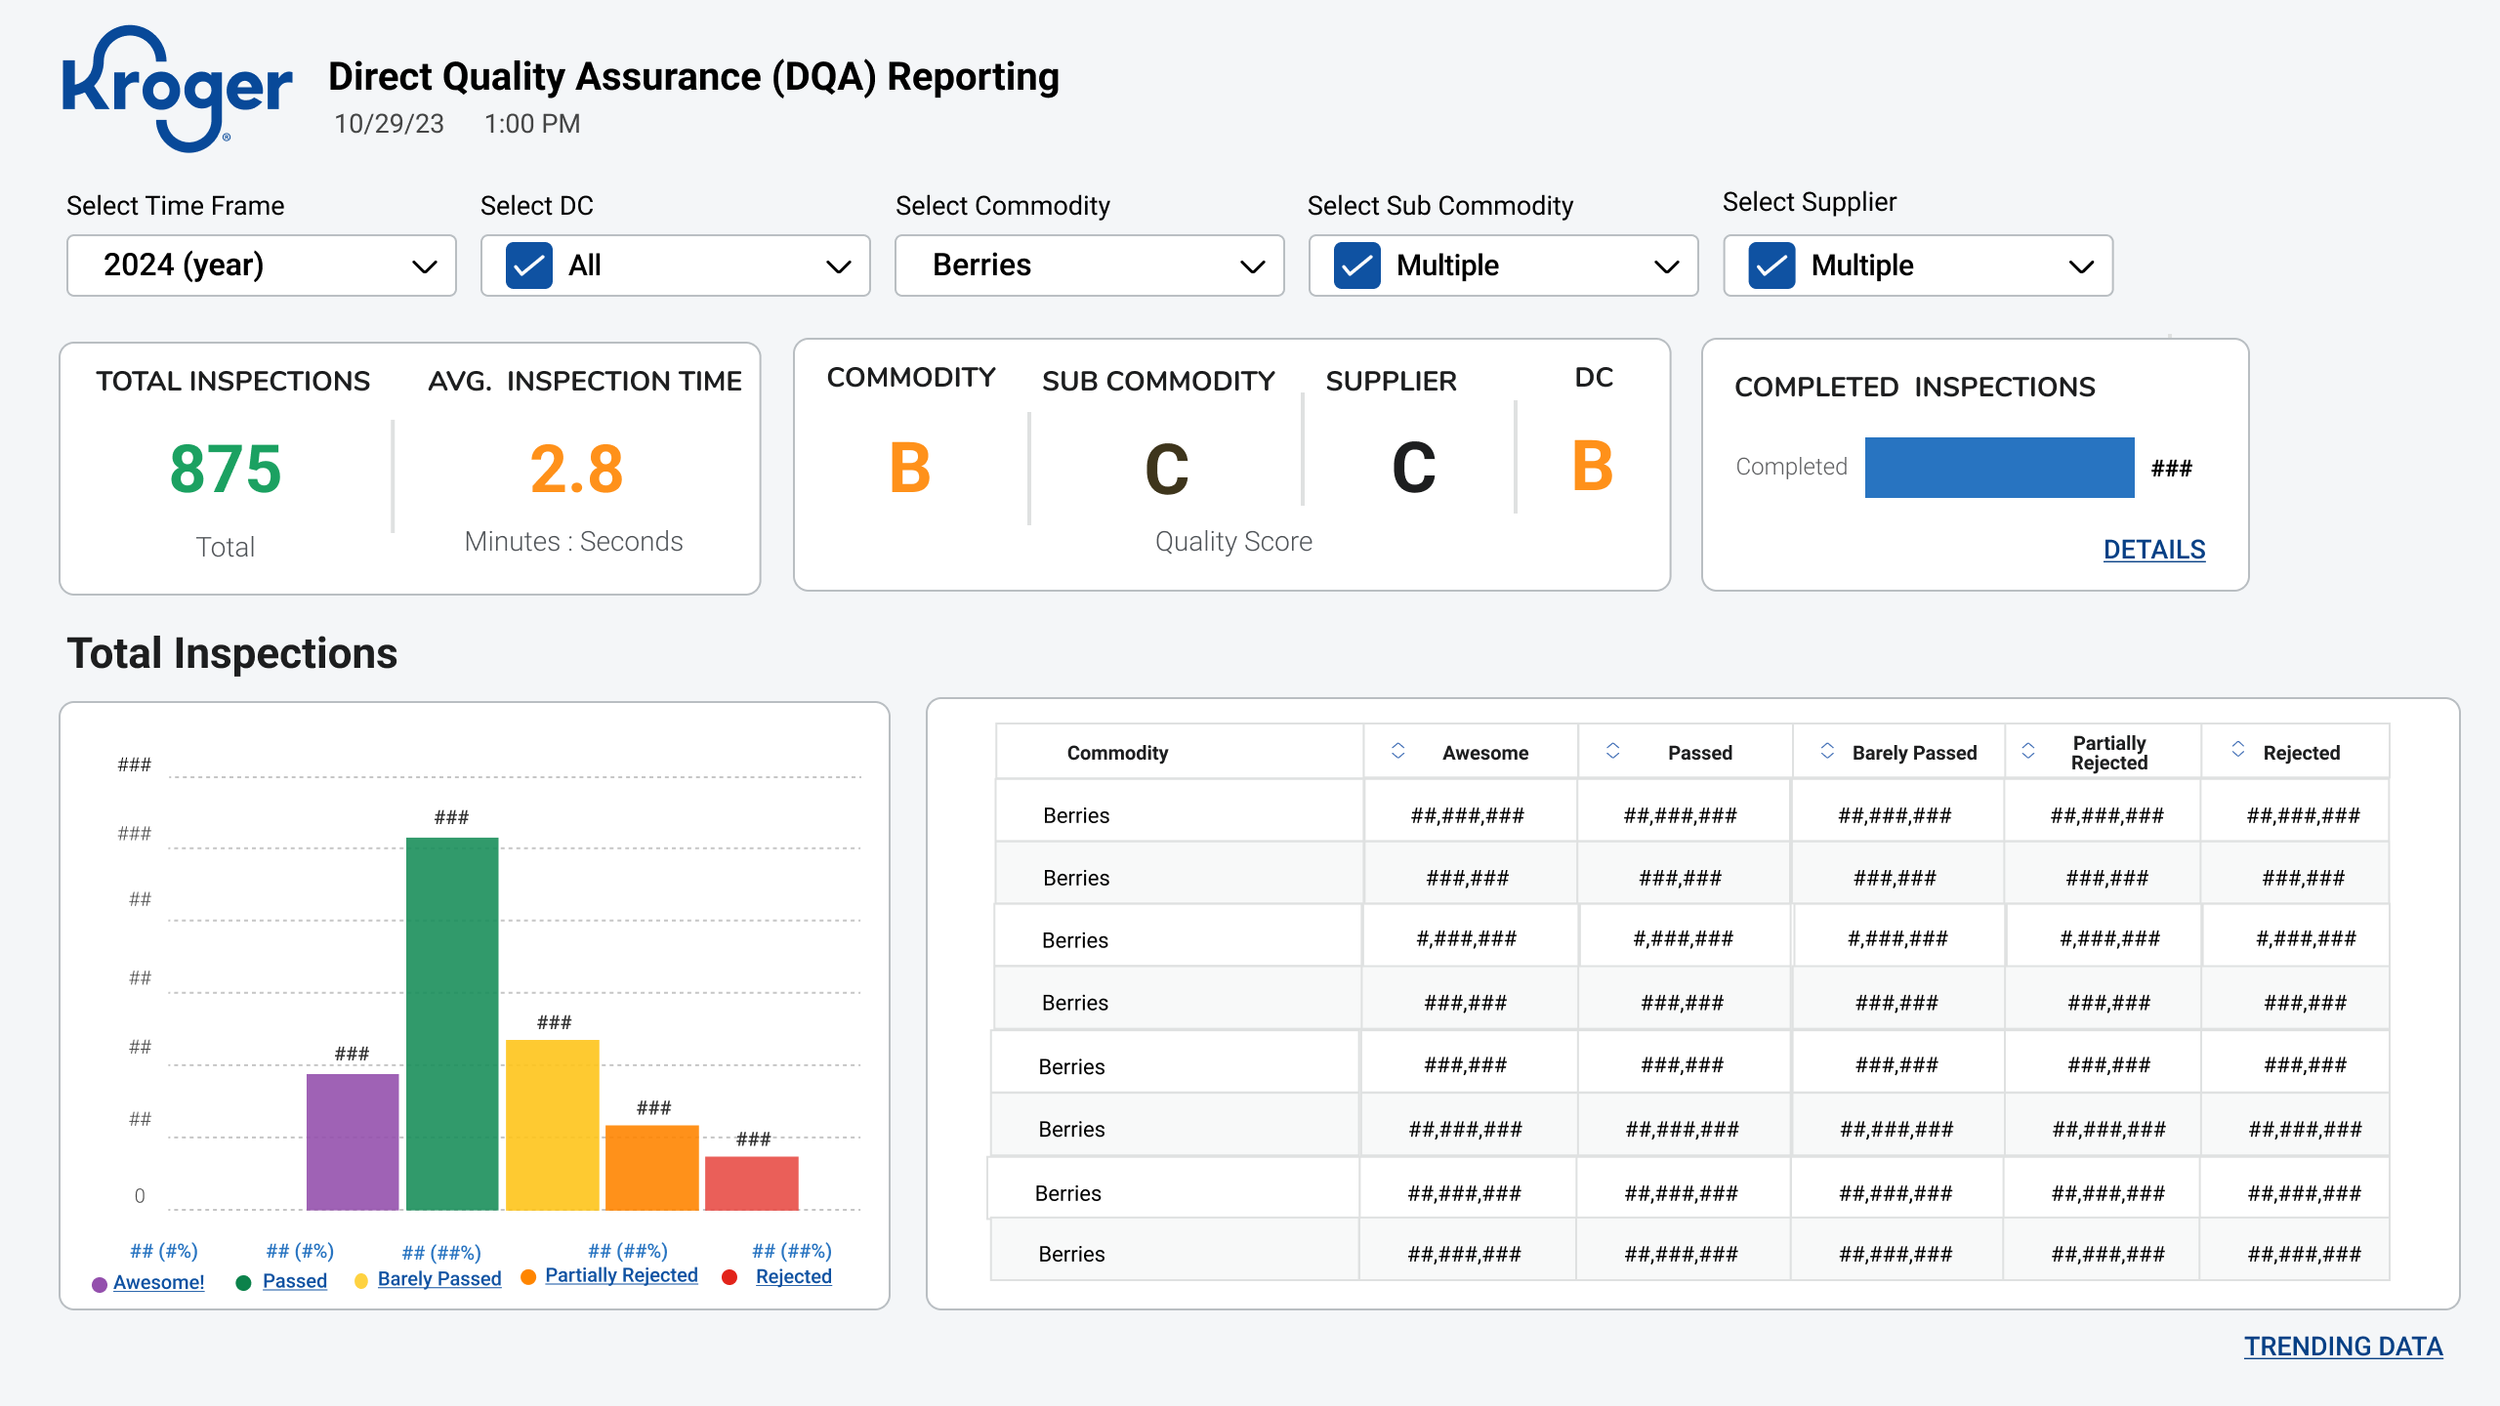
Direct Quality Assurance (DQA): After
DQA Results
Created live KPIs for Total Inspection data ad and grades of freshness broken down by commodity, subcommodity, supplier, and DC
We also were able to show the data for Total Inspections based on quality and a table UI that displayed an easy view with color coding based on grade of freshness
Increased users’ time and efficiency to get real-time answers by over 40%
Increased users’ trust in the product team by over 50% by conducting user sessions directly with them and showing results based on their needs.
Customer Days of Fresh Report (Before)
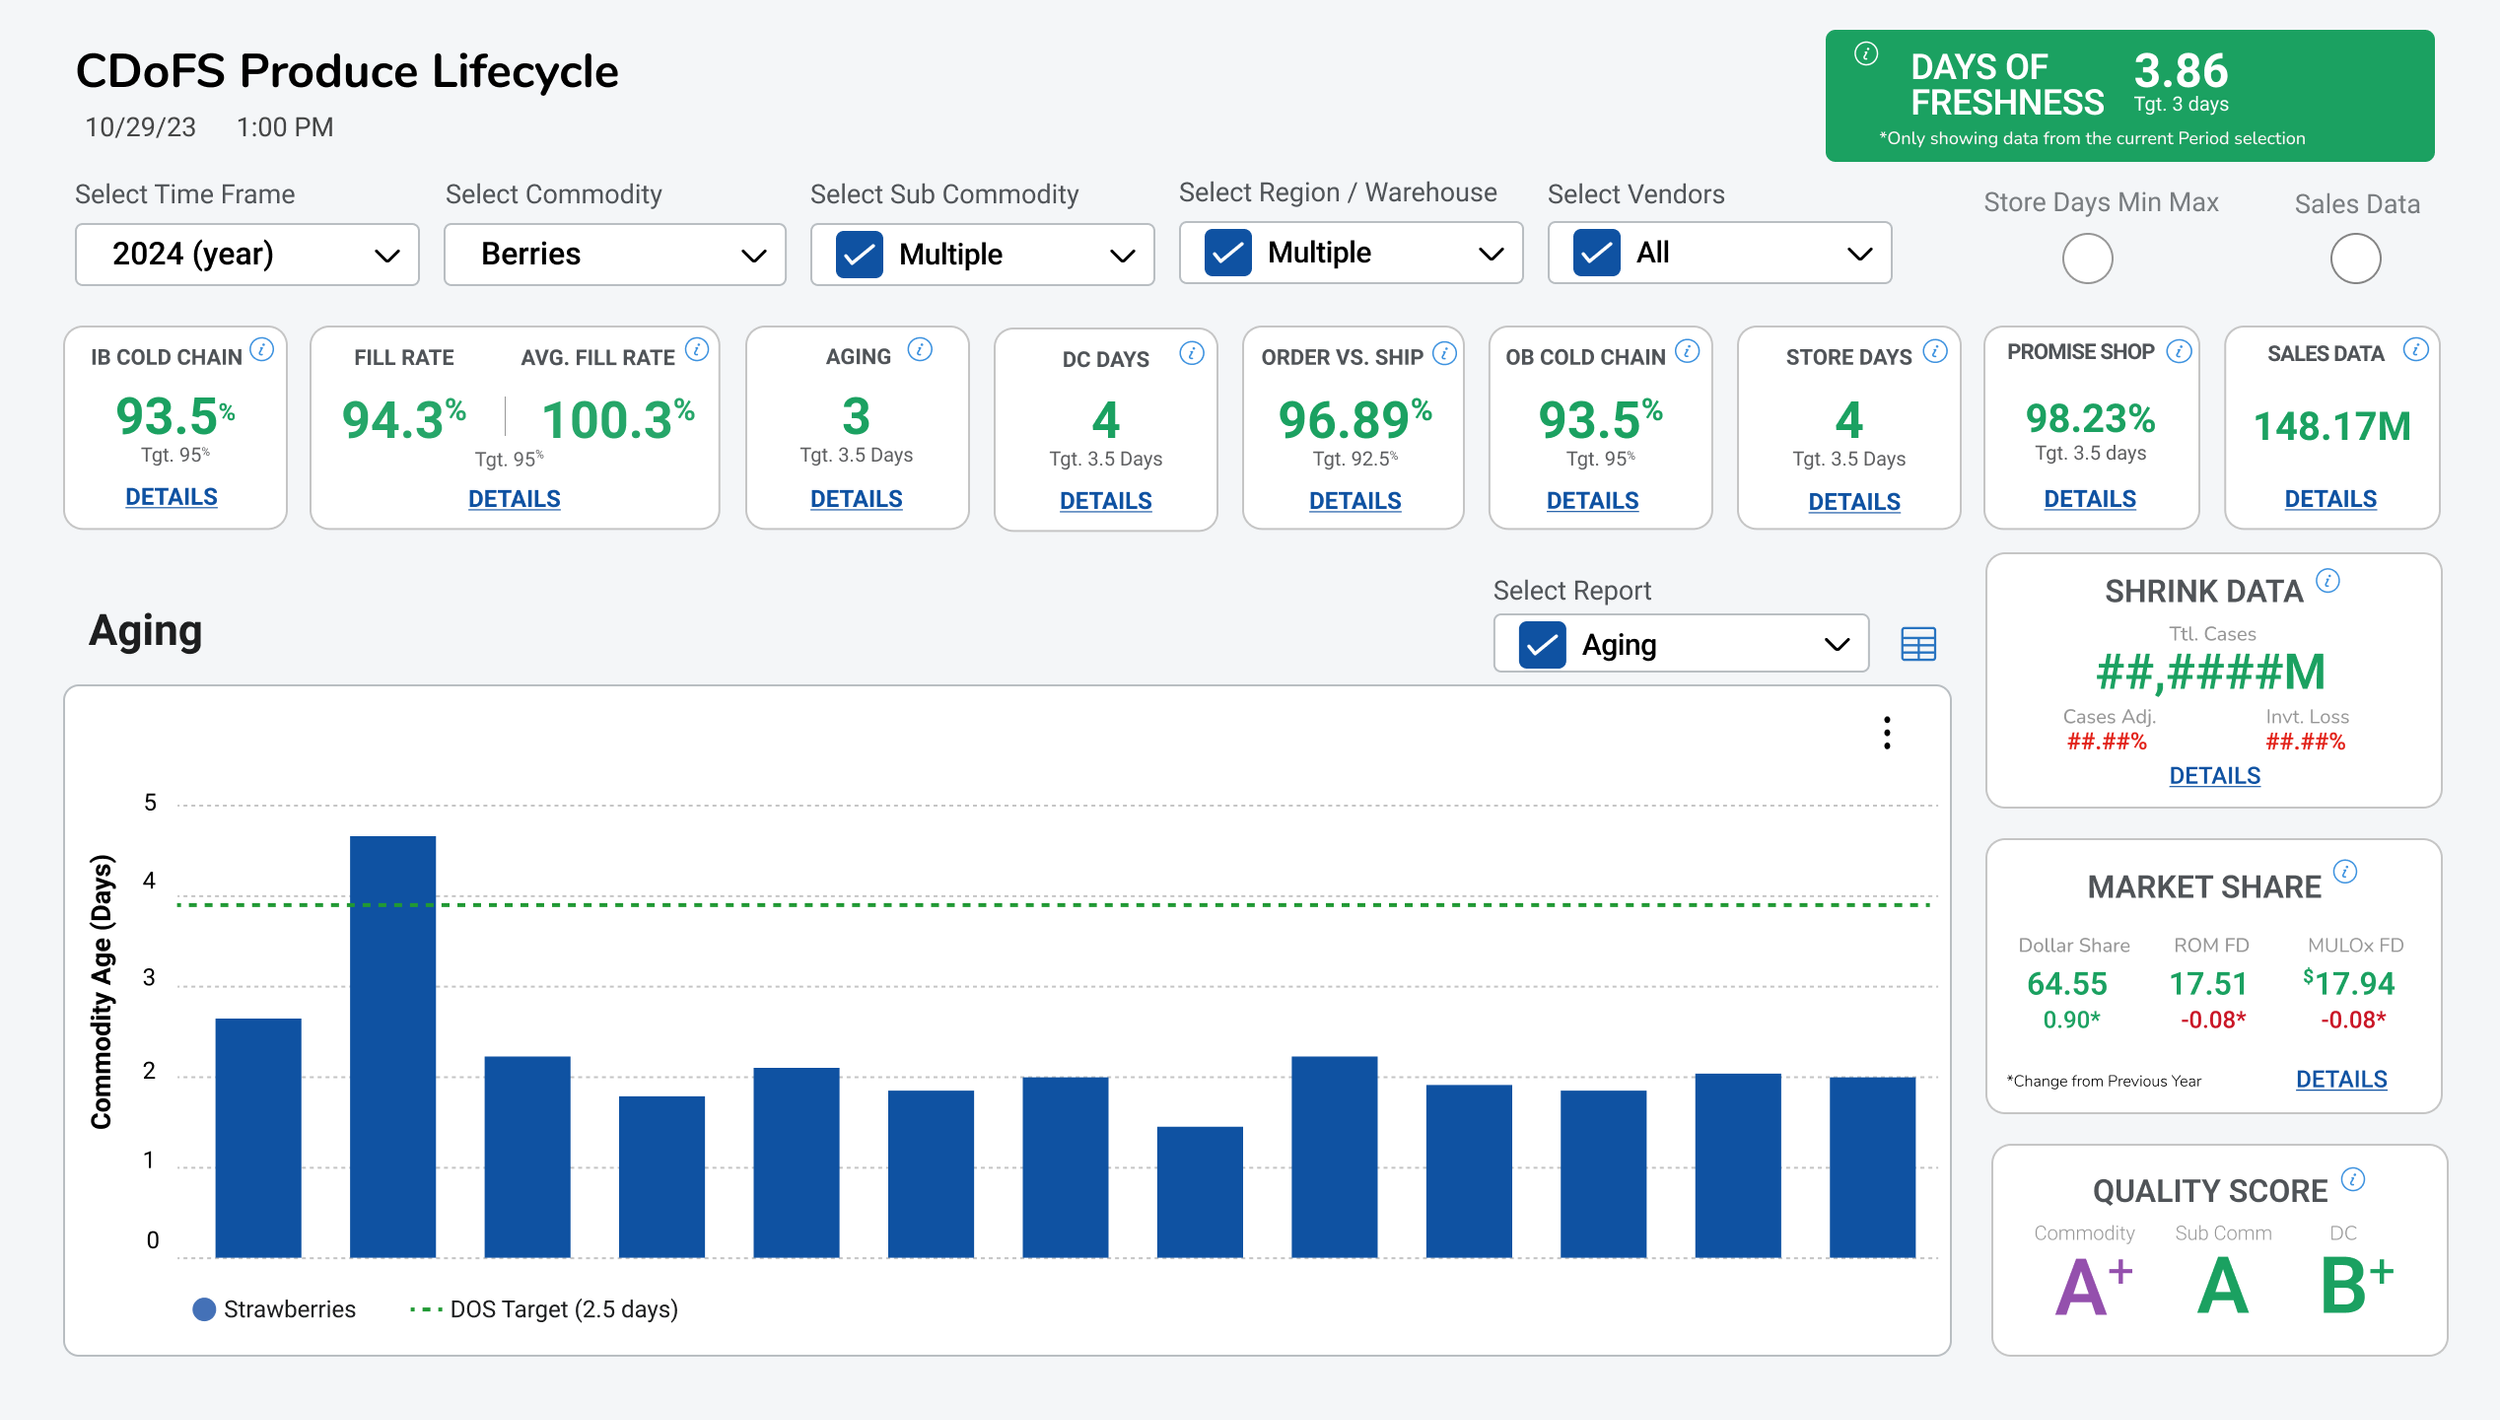
The CDOFs Report was a mess
There was no data hierarchy
Our Team continuously kept adding to it however, we needed to have some research and discovery to recreate the report and build a better visual hierarchy
CDOFS: Before
Step 1: I conducted a Card Sorting Activity with Users
I knew there was a hierarchy based on my current knowledge and wanted to see how they would categorize the data
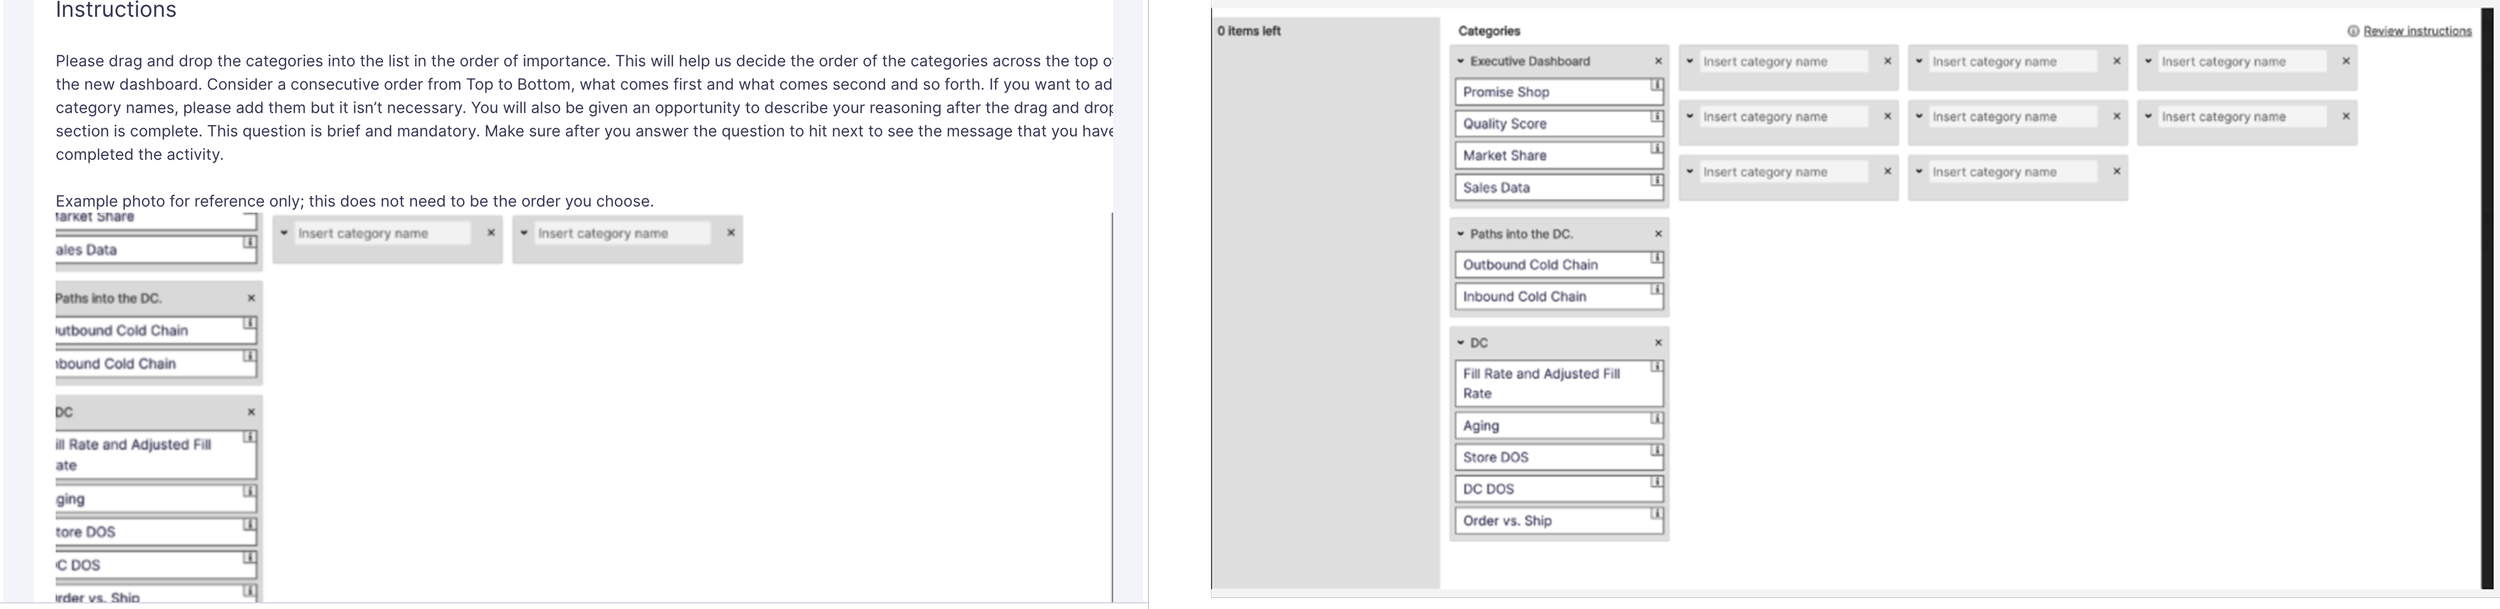
Step 1: I conducted a Card Sorting Activity with Users
I knew there was a hierarchy based on my current knowledge and wanted to see how they would categorize the data
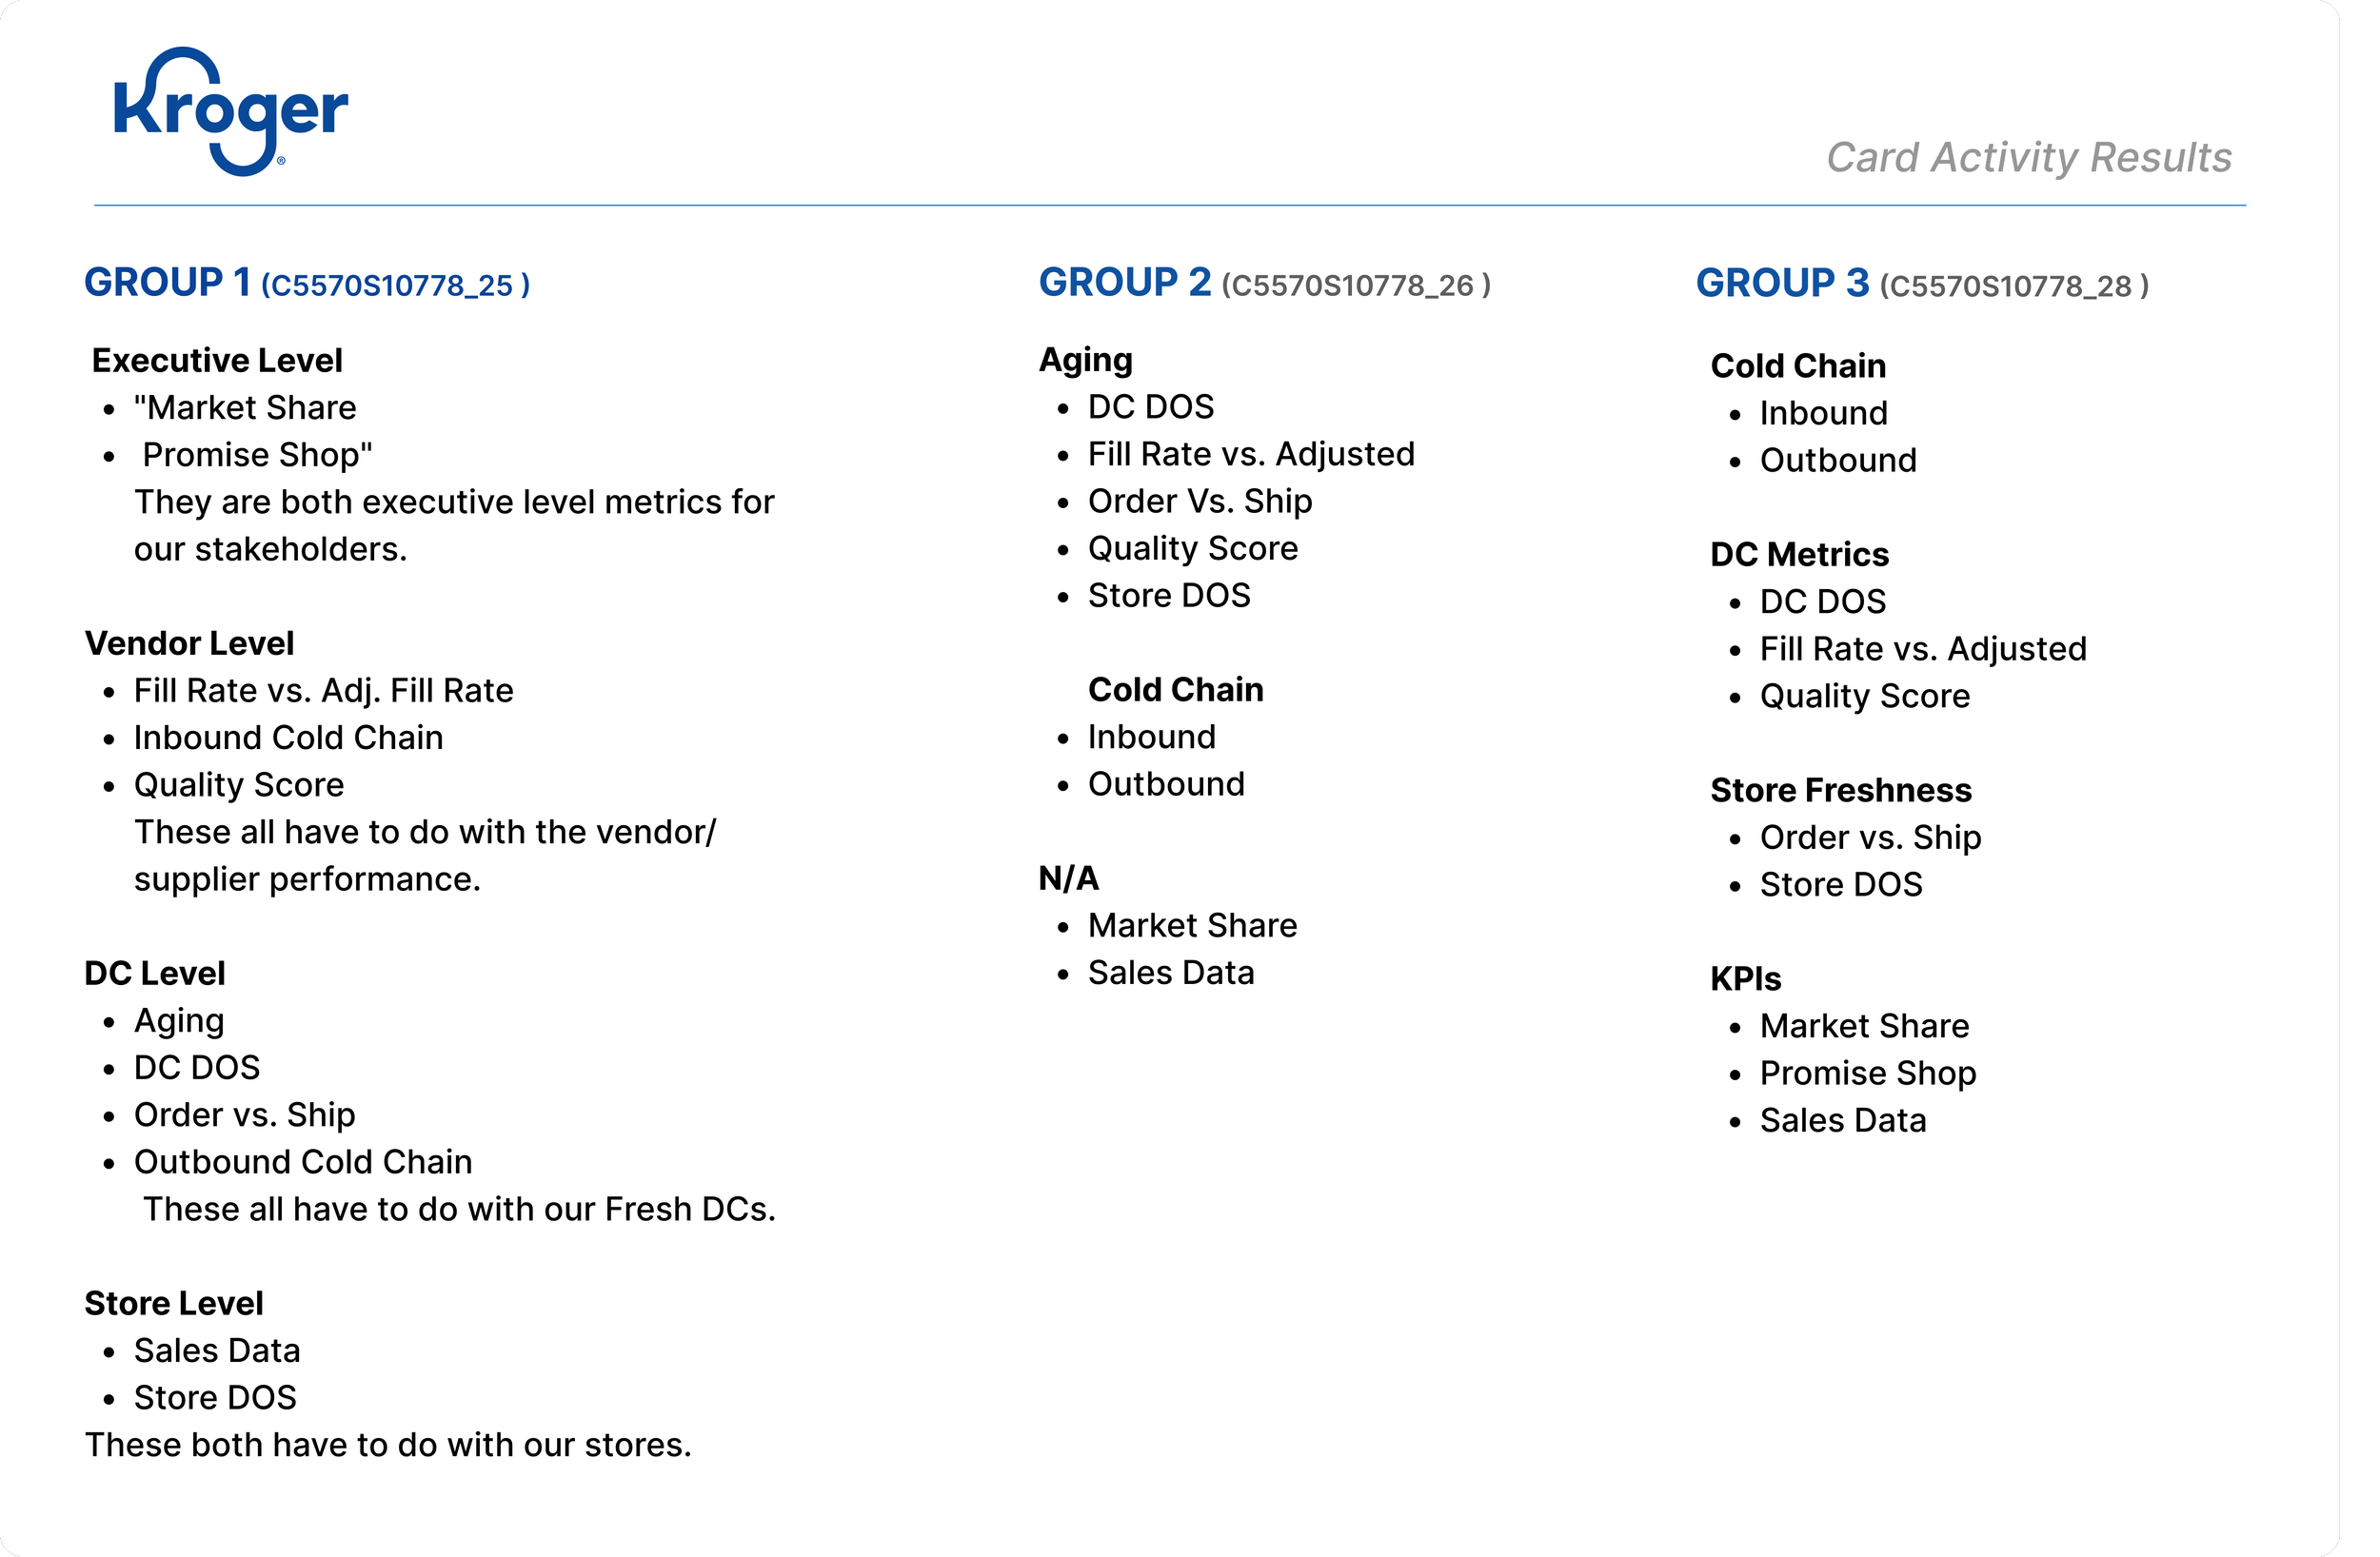
Results from the Activity helped me understand the heiarchry and the design path I wanted to head towards
Conducted A | B Testing based on LF prototypes to get close to the final decision

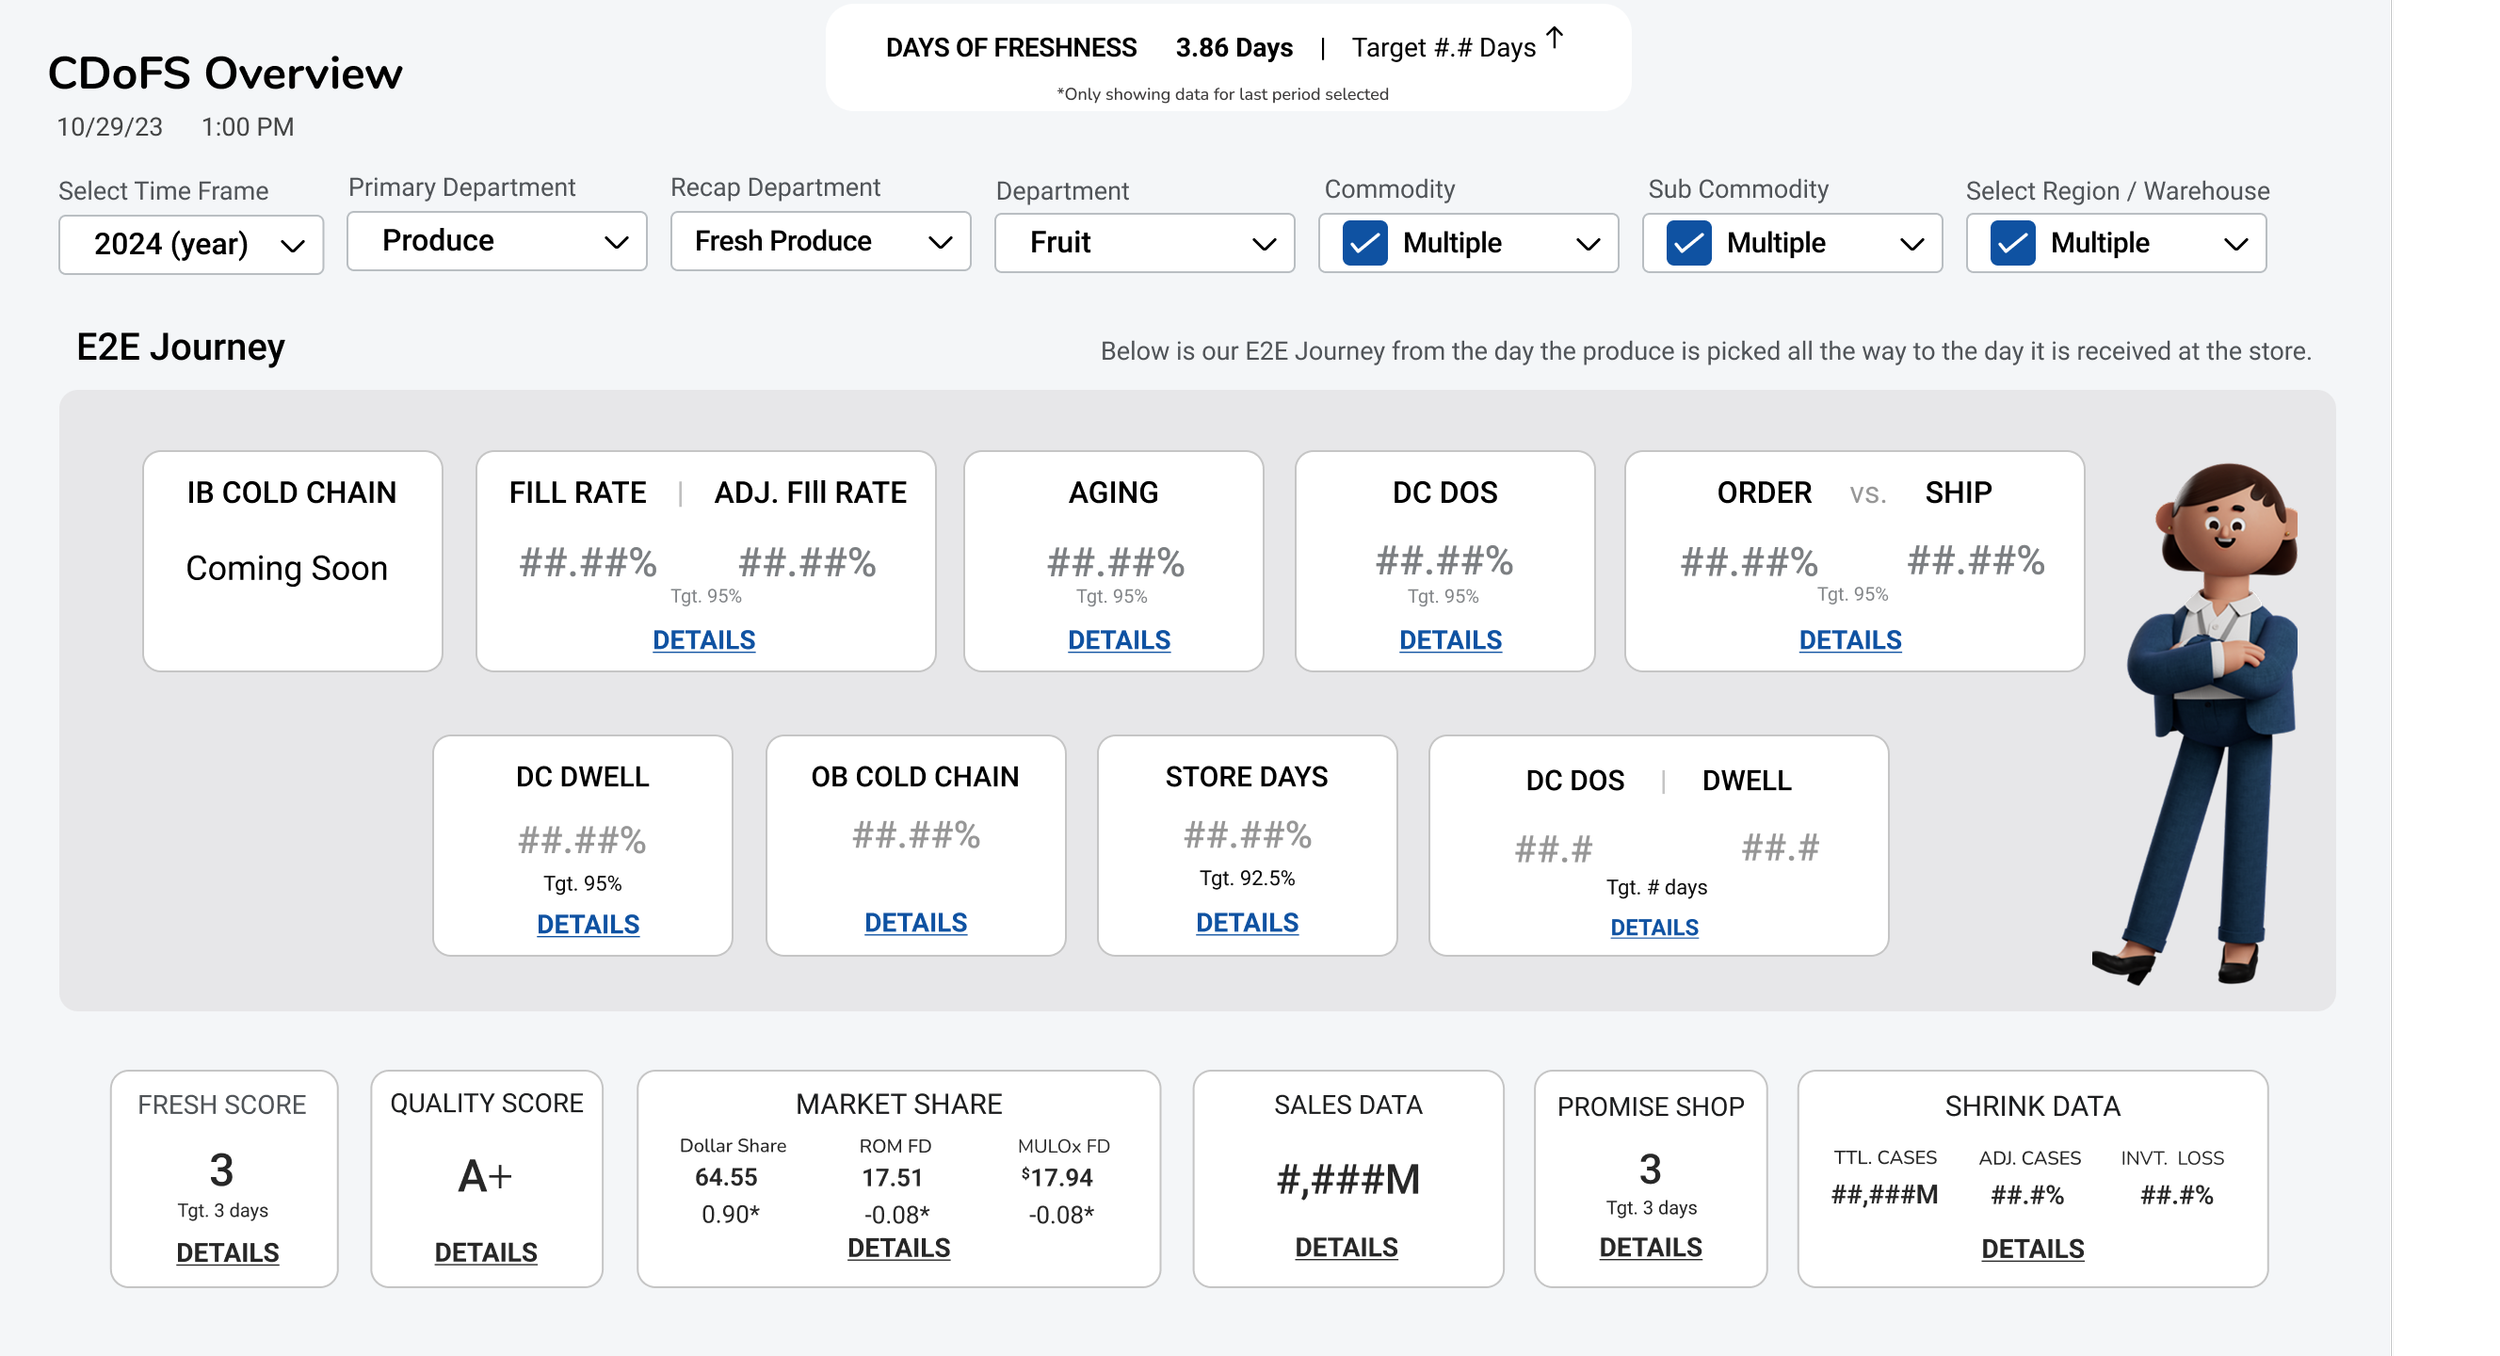
Results
- Established a clear data hierarchy: Consolidated and organized key findings into a structured data hierarchy that addressed the needs of multiple user groups, making information easier to interpret and enabling faster, more informed business decisions.
- Improved operational efficiency by over 40%: Streamlined access to relevant data and insights, helping users reduce time spent navigating information and make day-to-day decisions more efficiently.
- Strengthened relationships between users and stakeholders: Fostered stronger collaboration and trust by aligning product decisions with real user needs, creating a more connected relationship between end users, stakeholders and the product team